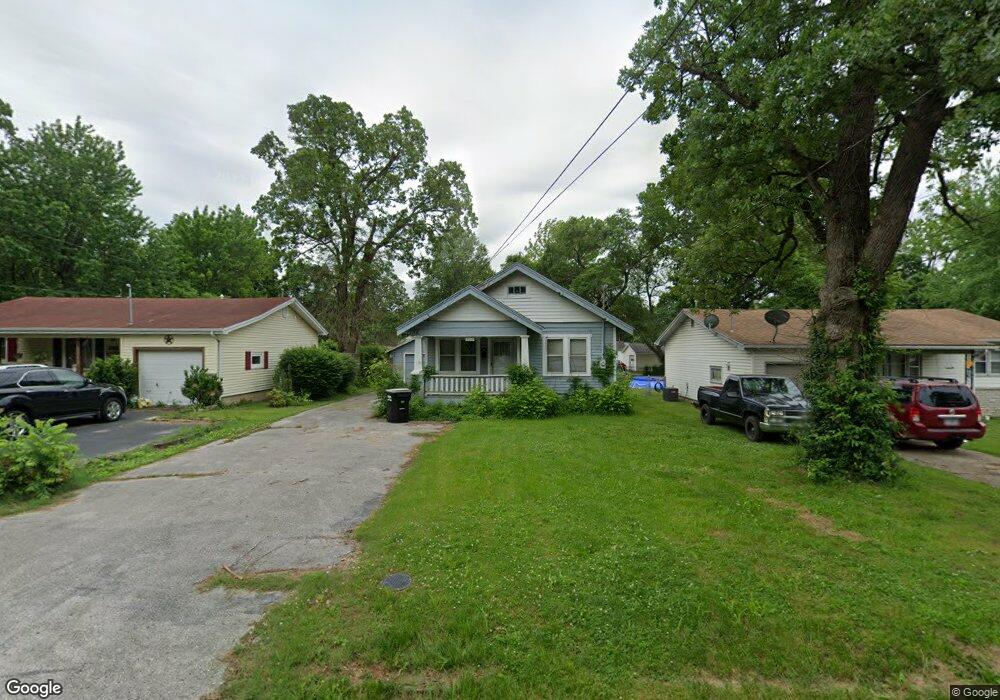
2018 W Calhoun St Springfield, MO 65802
Heart of the Westside NeighborhoodEstimated Value: $77,000 - $151,000
2
Beds
1
Bath
672
Sq Ft
$152/Sq Ft
Est. Value
About This Home
This home is located at 2018 W Calhoun St, Springfield, MO 65802 and is currently estimated at $102,419, approximately $152 per square foot. 2018 W Calhoun St is a home located in Greene County with nearby schools including York Elementary School, Pipkin Middle School, and Central High School.
Ownership History
Date
Name
Owned For
Owner Type
Purchase Details
Closed on
Sep 11, 2009
Sold by
Richards Stanley T and Richards Kelley S
Bought by
Ball John F
Current Estimated Value
Home Financials for this Owner
Home Financials are based on the most recent Mortgage that was taken out on this home.
Original Mortgage
$50,206
Outstanding Balance
$32,851
Interest Rate
5.2%
Mortgage Type
New Conventional
Estimated Equity
$69,568
Purchase Details
Closed on
Nov 12, 2008
Sold by
Us Bank Na
Bought by
Richards Stanley T
Purchase Details
Closed on
Sep 25, 2008
Sold by
Conlon Kristi and Conlon Kenneth
Bought by
U S Bank National Assn
Purchase Details
Closed on
Jun 8, 2005
Sold by
Pringle Gary and Pringle Brenda
Bought by
Conlon Kenneth and Conlon Kristi
Home Financials for this Owner
Home Financials are based on the most recent Mortgage that was taken out on this home.
Original Mortgage
$46,700
Interest Rate
9.57%
Mortgage Type
Adjustable Rate Mortgage/ARM
Create a Home Valuation Report for This Property
The Home Valuation Report is an in-depth analysis detailing your home's value as well as a comparison with similar homes in the area
Home Values in the Area
Average Home Value in this Area
Purchase History
| Date | Buyer | Sale Price | Title Company |
|---|---|---|---|
| Ball John F | -- | None Available | |
| Richards Stanley T | -- | Mokan Title Services Llc | |
| U S Bank National Assn | $36,270 | None Available | |
| Conlon Kenneth | -- | Meridian Title Company |
Source: Public Records
Mortgage History
| Date | Status | Borrower | Loan Amount |
|---|---|---|---|
| Open | Ball John F | $50,206 | |
| Previous Owner | Conlon Kenneth | $46,700 |
Source: Public Records
Tax History
| Year | Tax Paid | Tax Assessment Tax Assessment Total Assessment is a certain percentage of the fair market value that is determined by local assessors to be the total taxable value of land and additions on the property. | Land | Improvement |
|---|---|---|---|---|
| 2025 | $354 | $7,110 | $3,040 | $4,070 |
| 2024 | $288 | $5,360 | $1,900 | $3,460 |
| 2023 | $286 | $5,360 | $1,900 | $3,460 |
| 2022 | $294 | $5,380 | $1,900 | $3,480 |
| 2021 | $294 | $5,380 | $1,900 | $3,480 |
| 2020 | $302 | $5,280 | $1,900 | $3,380 |
| 2019 | $293 | $5,280 | $1,900 | $3,380 |
| 2018 | $315 | $5,680 | $1,900 | $3,780 |
| 2017 | $312 | $5,680 | $1,900 | $3,780 |
| 2016 | $311 | $5,680 | $1,900 | $3,780 |
| 2015 | $308 | $5,680 | $1,900 | $3,780 |
| 2014 | $308 | $5,640 | $1,900 | $3,740 |
Source: Public Records
Map
Nearby Homes
- 2019 W Webster St
- 2106 W Webster St
- 1327 N Marion Ave
- 1321 N Wabash Ave
- 1110 N Warren Ave
- 1735 W Webster St
- 1027 N Warren Ave
- 1711 W Webster St
- 827 N Marion Ave
- 1836 W Hovey St
- 1232 N Farmer Ave
- 903 N Lexington Ave
- 2326 W Nichols St
- 1535 W Calhoun St
- 3220 W Chestnut St
- 659 N Lafontaine Ave
- 1331 N West Ave
- 2150 W Chestnut St
- 1521 W Hamilton St
- 1520 W Lynn St
- 2024 W Calhoun St
- 2012 W Calhoun St
- 2006 W Calhoun St
- 1228 N Marion Ave
- 1232 N Marion Ave
- 2025 W Webster St
- 1300 N Marion Ave
- 2027 W Webster St
- 2011 W Webster St
- 1306 N Marion Ave
- 2017 W Calhoun St
- 2035 W Webster St
- 2001 W Calhoun St
- 2001 W Calhoun St
- 2011 W Calhoun St
- 1228 N Lafontaine Ave
- 2100 W Calhoun St
- 1312 N Marion Ave
- 1228 N La Fontaine Ave
- 1928 W Calhoun St
Your Personal Tour Guide
Ask me questions while you tour the home.