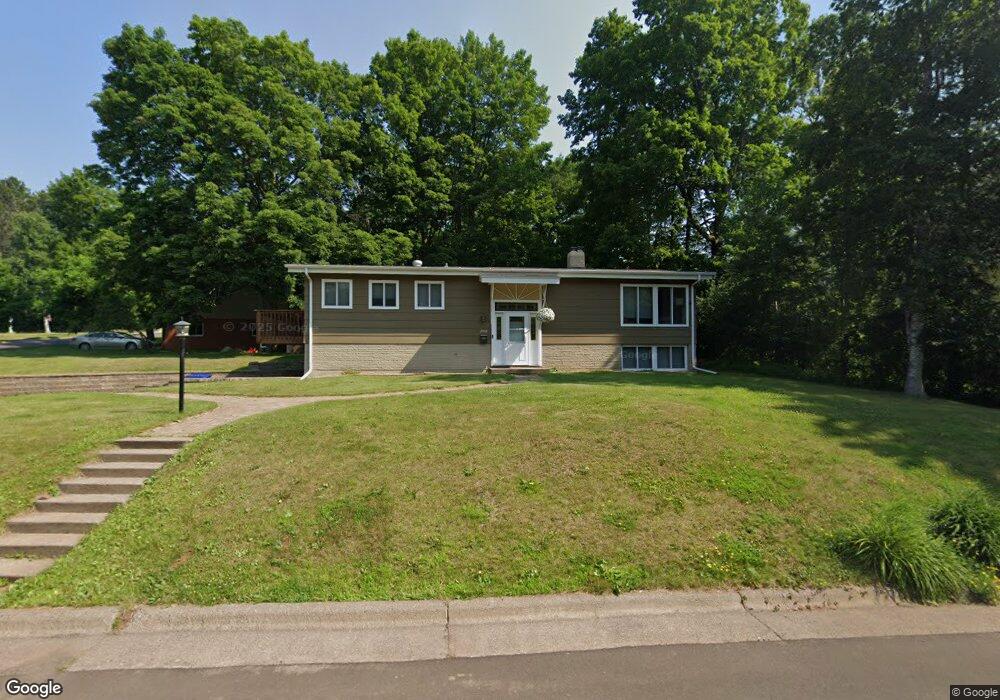
2018 Woodhaven Ln Duluth, MN 55803
Hunters Park NeighborhoodEstimated Value: $431,954 - $498,000
3
Beds
3
Baths
1,456
Sq Ft
$322/Sq Ft
Est. Value
About This Home
This home is located at 2018 Woodhaven Ln, Duluth, MN 55803 and is currently estimated at $468,739, approximately $321 per square foot. 2018 Woodhaven Ln is a home located in St. Louis County with nearby schools including Lowell Elementary School, Ordean East Middle School, and East High School.
Ownership History
Date
Name
Owned For
Owner Type
Purchase Details
Closed on
Apr 28, 2022
Sold by
Doucette Robert T and Doucette Ann W
Bought by
Christensen Corey and Christensen Katie
Current Estimated Value
Home Financials for this Owner
Home Financials are based on the most recent Mortgage that was taken out on this home.
Original Mortgage
$335,750
Outstanding Balance
$315,936
Interest Rate
4.42%
Mortgage Type
New Conventional
Estimated Equity
$152,803
Purchase Details
Closed on
Jul 30, 2015
Sold by
Doucette Ann W and Doucette Robert T
Bought by
Doucette Ann W and Doucette Robert T
Purchase Details
Closed on
Sep 18, 2006
Sold by
Stach Loren D and Stach Margaret K
Bought by
Doucette Ann W
Home Financials for this Owner
Home Financials are based on the most recent Mortgage that was taken out on this home.
Original Mortgage
$172,800
Interest Rate
6.49%
Mortgage Type
Purchase Money Mortgage
Create a Home Valuation Report for This Property
The Home Valuation Report is an in-depth analysis detailing your home's value as well as a comparison with similar homes in the area
Home Values in the Area
Average Home Value in this Area
Purchase History
| Date | Buyer | Sale Price | Title Company |
|---|---|---|---|
| Christensen Corey | $395,000 | First American Title | |
| Doucette Ann W | -- | None Available | |
| Doucette Ann W | $195,000 | Rels |
Source: Public Records
Mortgage History
| Date | Status | Borrower | Loan Amount |
|---|---|---|---|
| Open | Christensen Corey | $335,750 | |
| Previous Owner | Doucette Ann W | $172,800 |
Source: Public Records
Tax History Compared to Growth
Tax History
| Year | Tax Paid | Tax Assessment Tax Assessment Total Assessment is a certain percentage of the fair market value that is determined by local assessors to be the total taxable value of land and additions on the property. | Land | Improvement |
|---|---|---|---|---|
| 2024 | $4,256 | $325,300 | $60,100 | $265,200 |
| 2023 | $4,256 | $331,000 | $60,100 | $270,900 |
| 2022 | $3,940 | $304,000 | $56,300 | $247,700 |
| 2021 | $3,862 | $251,500 | $46,400 | $205,100 |
| 2020 | $3,766 | $251,500 | $46,400 | $205,100 |
| 2019 | $3,338 | $239,900 | $48,600 | $191,300 |
| 2018 | $3,116 | $217,400 | $48,600 | $168,800 |
| 2017 | $2,740 | $217,400 | $48,600 | $168,800 |
| 2016 | $2,676 | $194,700 | $44,700 | $150,000 |
| 2015 | $2,450 | $156,000 | $34,600 | $121,400 |
| 2014 | $2,440 | $156,000 | $34,600 | $121,400 |
Source: Public Records
Map
Nearby Homes
- 1956 Woodhaven Ln
- 2xxx Harvard Ave
- 937 W Arrowhead Rd
- 2234 Dunedin Ave
- xxx Catherine St
- 1205 W Arrowhead Rd
- 1229 W Arrowhead Rd
- 1838 Vermilion Rd
- 48 E Buffalo St
- 223 Mygatt Ave
- 6 Minneapolis Ave
- 1039 Brainerd Ave
- 2314 E 5th St
- 2418 E 4th St
- 1123 Valley Dr
- 529 Woodland Ave
- 245 W Anoka St
- 2701 E 2nd St
- 18 E Wabasha St
- 3406 E 4th St
- 2030 Woodhaven Ln
- 2010 Woodhaven Ln
- 2029 Hartley Rd
- 2021 Hartley Rd
- 2015 Woodhaven Ln
- 2003 Woodhaven Ln
- 2027 Woodhaven Ln
- 2033 Woodhaven Ln
- 2015 Hartley Rd
- 2004 Woodhaven Ln
- 2023 Woodhaven Ln
- 2039 Woodhaven Ln
- 1953 Woodhaven Ln
- 2001 Hartley Rd
- 2032 Hartley Rd
- 2026 Hartley Rd
- 1941 Woodhaven Ln
- 1963 Hartley Rd
- 2020 Hartley Rd
- 2105 Woodhaven Ln