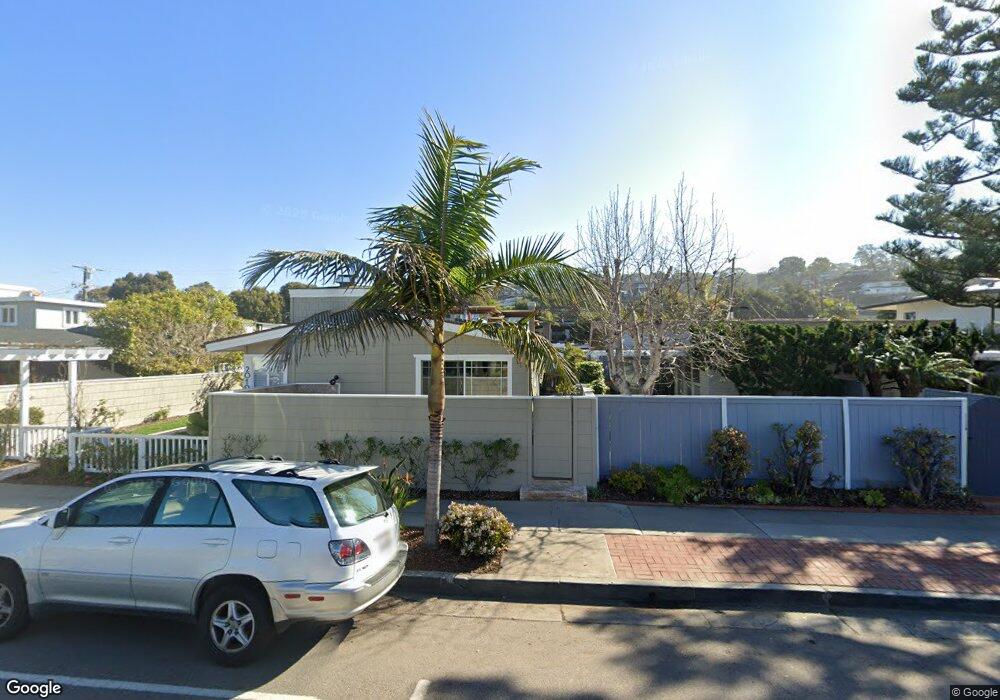
2019 Coast Blvd Unit 21 Del Mar, CA 92014
Estimated Value: $3,589,589 - $5,138,000
3
Beds
3
Baths
2,270
Sq Ft
$1,959/Sq Ft
Est. Value
About This Home
This home is located at 2019 Coast Blvd Unit 21, Del Mar, CA 92014 and is currently estimated at $4,445,863, approximately $1,958 per square foot. 2019 Coast Blvd Unit 21 is a home located in San Diego County with nearby schools including Del Mar Heights School, Del Mar Hills Elementary School, and Earl Warren Middle School.
Ownership History
Date
Name
Owned For
Owner Type
Purchase Details
Closed on
May 26, 2016
Sold by
Holker Bryan D and Holker Diana M
Bought by
The Bryan D Holker & Diana M Holke Famil
Current Estimated Value
Home Financials for this Owner
Home Financials are based on the most recent Mortgage that was taken out on this home.
Original Mortgage
$1,000,000
Outstanding Balance
$775,327
Interest Rate
2.8%
Mortgage Type
Adjustable Rate Mortgage/ARM
Estimated Equity
$3,670,536
Purchase Details
Closed on
Apr 29, 2003
Sold by
Holker Bryan D and Holker Diana M
Bought by
Holker Bryan D and Holker Diana M
Purchase Details
Closed on
Dec 4, 1993
Sold by
Holker Bryan D
Bought by
Holker Bryan D and Holker Diana M
Home Financials for this Owner
Home Financials are based on the most recent Mortgage that was taken out on this home.
Original Mortgage
$422,500
Interest Rate
4.12%
Create a Home Valuation Report for This Property
The Home Valuation Report is an in-depth analysis detailing your home's value as well as a comparison with similar homes in the area
Home Values in the Area
Average Home Value in this Area
Purchase History
| Date | Buyer | Sale Price | Title Company |
|---|---|---|---|
| The Bryan D Holker & Diana M Holke Famil | -- | Chicago Title Company | |
| Holker Bryan D | -- | -- | |
| Holker Bryan D | -- | -- | |
| Holker Bryan D | -- | Commonwealth Land Title Co |
Source: Public Records
Mortgage History
| Date | Status | Borrower | Loan Amount |
|---|---|---|---|
| Open | The Bryan D Holker & Diana M Holke Famil | $1,000,000 | |
| Previous Owner | Holker Bryan D | $422,500 |
Source: Public Records
Tax History
| Year | Tax Paid | Tax Assessment Tax Assessment Total Assessment is a certain percentage of the fair market value that is determined by local assessors to be the total taxable value of land and additions on the property. | Land | Improvement |
|---|---|---|---|---|
| 2025 | $6,405 | $612,763 | $416,591 | $196,172 |
| 2024 | $6,405 | $600,749 | $408,423 | $192,326 |
| 2023 | $6,262 | $588,970 | $400,415 | $188,555 |
| 2022 | $6,159 | $577,422 | $392,564 | $184,858 |
| 2021 | $5,931 | $566,101 | $384,867 | $181,234 |
| 2020 | $5,982 | $560,297 | $380,921 | $179,376 |
| 2019 | $5,863 | $549,311 | $373,452 | $175,859 |
| 2018 | $5,604 | $538,541 | $366,130 | $172,411 |
| 2017 | $110 | $527,982 | $358,951 | $169,031 |
| 2016 | $5,315 | $517,630 | $351,913 | $165,717 |
| 2015 | $5,234 | $509,855 | $346,627 | $163,228 |
| 2014 | $5,126 | $499,869 | $339,838 | $160,031 |
Source: Public Records
Map
Nearby Homes
- 2016 Ocean Front
- 145 22nd St
- 1834 Ocean Front Unit 36
- 2026 Seaview Ave
- 000 Camino Del Mar
- 1715-17 Coast Blvd
- 1716 Ocean Front
- 2150 Balboa Ave
- 2029 Balboa Ave
- 2609 Camino Del Mar
- 2165 Balboa Ave
- 1970 Zapo St
- 1562 Camino Del Mar Unit 639
- 1562 Camino Del Mar Unit 643
- 1552 Camino Del Mar Unit 401
- 2921 Sandy Pointe Unit 3
- 00000 Hidden Pines
- 459 Carolina Rd
- 3000 Sandy Ln
- 386 13th St
- 2027 Coast Blvd Unit 29
- 2011-13 Coast Blvd
- 2037 Coast Blvd
- 2035 Coast Blvd Unit 37
- 2003 Coast Blvd Unit 5
- 2020 Santa fe Ave
- 2012 Santa fe Ave
- 2028 Santa fe Ave
- 2041 Coast Blvd Unit 43
- 226 20th St
- 2034 Santa fe Ave
- 2018 Coast Blvd Unit 20
- 2018-20 Coast Blvd
- 2014 Coast Blvd
- 2030 Coast Blvd Unit 32
- 2069 Coast Blvd
- 1953 Coast Blvd
- 1951 Coast Blvd Unit 53
- 2004 Coast Blvd
- 2049 Coast Blvd Unit 51
Your Personal Tour Guide
Ask me questions while you tour the home.