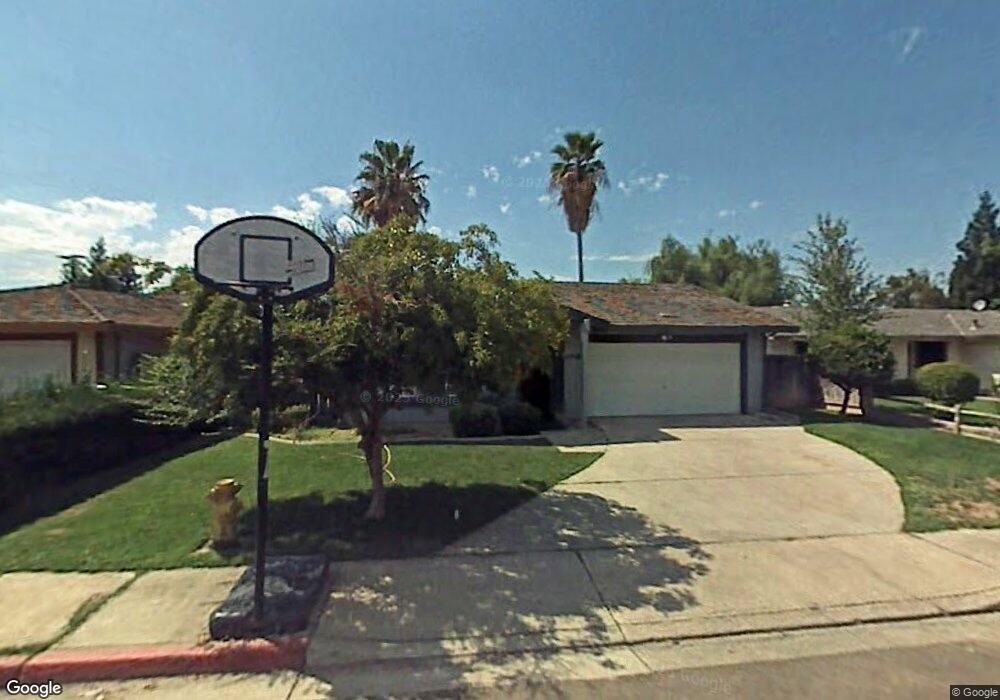
2019 Garden Ln Turlock, CA 95382
Estimated Value: $372,000 - $452,000
3
Beds
2
Baths
1,372
Sq Ft
$298/Sq Ft
Est. Value
About This Home
This home is located at 2019 Garden Ln, Turlock, CA 95382 and is currently estimated at $408,865, approximately $298 per square foot. 2019 Garden Ln is a home located in Stanislaus County with nearby schools including Walter M. Brown Elementary School, Marvin A. Dutcher Middle School, and Turlock Junior High School.
Ownership History
Date
Name
Owned For
Owner Type
Purchase Details
Closed on
Feb 28, 2007
Sold by
Montero Matilde
Bought by
Montero Efer
Current Estimated Value
Home Financials for this Owner
Home Financials are based on the most recent Mortgage that was taken out on this home.
Original Mortgage
$268,000
Outstanding Balance
$167,604
Interest Rate
7.25%
Mortgage Type
New Conventional
Estimated Equity
$241,261
Purchase Details
Closed on
Jun 23, 1998
Sold by
Bankers Trust Company New York Corp
Bought by
Montero Ef Er and Montero Matilde
Home Financials for this Owner
Home Financials are based on the most recent Mortgage that was taken out on this home.
Original Mortgage
$98,233
Interest Rate
7.03%
Mortgage Type
FHA
Purchase Details
Closed on
Nov 11, 1997
Sold by
Padilla Juan J and Padilla Ernestina
Bought by
Bankers Trust Company
Create a Home Valuation Report for This Property
The Home Valuation Report is an in-depth analysis detailing your home's value as well as a comparison with similar homes in the area
Purchase History
| Date | Buyer | Sale Price | Title Company |
|---|---|---|---|
| Montero Efer | -- | Alliance Title Company | |
| Montero Ef Er | $98,500 | Fidelity National Title Co | |
| Bankers Trust Company | $81,000 | First American Title Ins Co |
Source: Public Records
Mortgage History
| Date | Status | Borrower | Loan Amount |
|---|---|---|---|
| Open | Montero Efer | $268,000 | |
| Closed | Montero Ef Er | $98,233 |
Source: Public Records
Tax History
| Year | Tax Paid | Tax Assessment Tax Assessment Total Assessment is a certain percentage of the fair market value that is determined by local assessors to be the total taxable value of land and additions on the property. | Land | Improvement |
|---|---|---|---|---|
| 2025 | $1,584 | $154,401 | $47,022 | $107,379 |
| 2024 | $1,553 | $151,374 | $46,100 | $105,274 |
| 2023 | $1,549 | $148,407 | $45,197 | $103,210 |
| 2022 | $1,529 | $145,498 | $44,311 | $101,187 |
| 2021 | $1,505 | $142,646 | $43,443 | $99,203 |
| 2020 | $1,493 | $141,184 | $42,998 | $98,186 |
| 2019 | $1,467 | $138,416 | $42,155 | $96,261 |
| 2018 | $1,464 | $135,703 | $41,329 | $94,374 |
| 2017 | $1,428 | $133,043 | $40,519 | $92,524 |
| 2016 | $1,333 | $130,435 | $39,725 | $90,710 |
| 2015 | $1,320 | $128,477 | $39,129 | $89,348 |
| 2014 | $1,305 | $125,961 | $38,363 | $87,598 |
Source: Public Records
Map
Nearby Homes
- 1186 Kay Cir
- 2375 Oxford Ave
- 1114 Kay Cir
- 2261 Peace Way
- 517 W Tuolumne Rd
- 1880 Donnelly Park Dr
- 2621 Dels Ln
- 2660 Oxford Ave
- 2700 Oxford Ave
- 425 20th Century Blvd Unit E-1
- 425 20th Century Blvd Unit A13
- 520 Allen Way
- 240 W Tuolumne Rd
- 100 Pedras Rd
- 2755 N Walnut Rd Unit 114
- 1733 Geer Rd
- 805 Cole Ave
- 1400 N Tully Rd Unit 120
- 1400 N Tully Rd Unit 91
- 1400 N Tully Rd Unit 168
- 2039 Garden Ln
- 2001 Garden Ln
- 2020 Oxford Ave
- 2000 Oxford Ave
- 2040 Oxford Ave
- 2059 Garden Ln
- 2060 Oxford Ave
- 2080 Oxford Ave
- 2010 Garden Ln
- 2079 Garden Ln
- 2030 Garden Ln
- 901 Pedras Rd
- 2100 Oxford Ave
- 2050 Garden Ln
- 2005 Oxford Ave
- 2099 Garden Ln
- 2120 Oxford Ave
- 2050 Joynichole Dr
- 2070 Garden Ln
- 1021 Pedras Rd
Your Personal Tour Guide
Ask me questions while you tour the home.