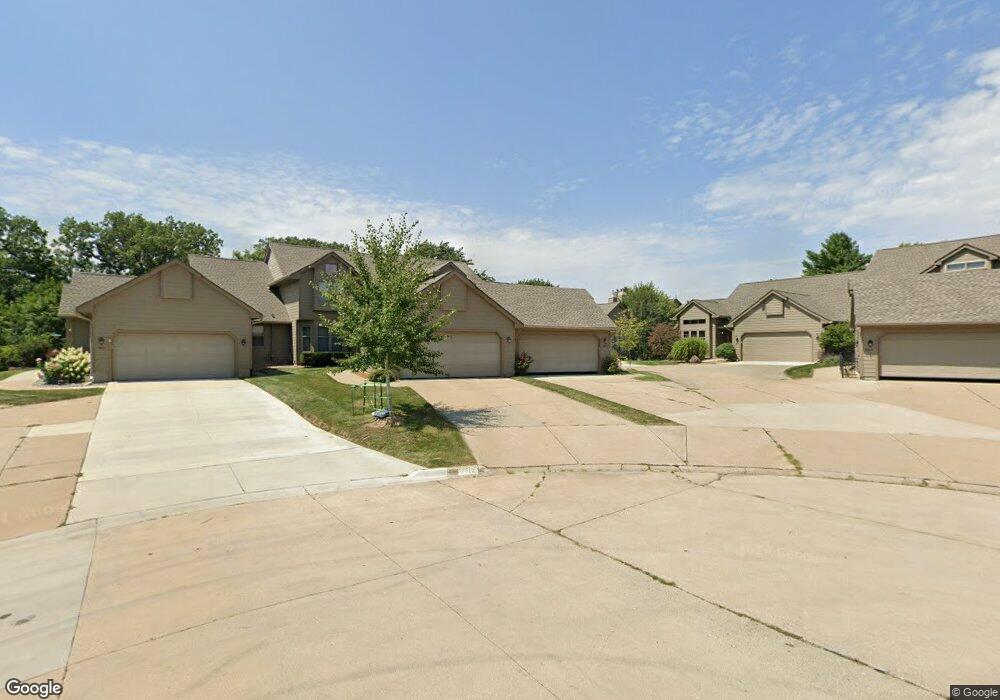
2019 Maple Cir West Des Moines, IA 50265
Estimated Value: $262,114 - $321,000
--
Bed
2
Baths
1,436
Sq Ft
$202/Sq Ft
Est. Value
About This Home
This home is located at 2019 Maple Cir, West Des Moines, IA 50265 and is currently estimated at $290,279, approximately $202 per square foot. 2019 Maple Cir is a home located in Polk County with nearby schools including Fairmeadows Elementary School, Stilwell Junior High School, and Valley Southwoods Freshman High School.
Ownership History
Date
Name
Owned For
Owner Type
Purchase Details
Closed on
Nov 18, 2020
Sold by
John R Bonham Revocable Trust and Buckner Kent
Bought by
Rutledge William Albert and Rutledge Morna Irene
Current Estimated Value
Home Financials for this Owner
Home Financials are based on the most recent Mortgage that was taken out on this home.
Original Mortgage
$144,000
Outstanding Balance
$127,847
Interest Rate
2.8%
Mortgage Type
New Conventional
Estimated Equity
$162,432
Purchase Details
Closed on
Oct 4, 2013
Sold by
Bonham John R
Bought by
Bonham John R and John R Bonham Revocable Trust
Purchase Details
Closed on
Oct 22, 2007
Sold by
Hollander Emery A and Hollander Bob Emery
Bought by
Bonham John R
Create a Home Valuation Report for This Property
The Home Valuation Report is an in-depth analysis detailing your home's value as well as a comparison with similar homes in the area
Home Values in the Area
Average Home Value in this Area
Purchase History
| Date | Buyer | Sale Price | Title Company |
|---|---|---|---|
| Rutledge William Albert | $240,000 | None Listed On Document | |
| Rutledge William Albert | $240,000 | None Listed On Document | |
| Bonham John R | -- | None Available | |
| Bonham John R | $219,500 | Itc |
Source: Public Records
Mortgage History
| Date | Status | Borrower | Loan Amount |
|---|---|---|---|
| Open | Rutledge William Albert | $144,000 | |
| Closed | Rutledge William Albert | $144,000 |
Source: Public Records
Tax History Compared to Growth
Tax History
| Year | Tax Paid | Tax Assessment Tax Assessment Total Assessment is a certain percentage of the fair market value that is determined by local assessors to be the total taxable value of land and additions on the property. | Land | Improvement |
|---|---|---|---|---|
| 2025 | $3,610 | $274,000 | $31,800 | $242,200 |
| 2024 | $3,610 | $245,200 | $28,100 | $217,100 |
| 2023 | $3,682 | $245,200 | $28,100 | $217,100 |
| 2022 | $3,638 | $199,600 | $23,700 | $175,900 |
| 2021 | $3,786 | $199,600 | $23,700 | $175,900 |
| 2020 | $3,726 | $197,400 | $24,800 | $172,600 |
| 2019 | $3,490 | $197,400 | $24,800 | $172,600 |
| 2018 | $3,494 | $178,900 | $23,900 | $155,000 |
| 2017 | $3,264 | $178,900 | $23,900 | $155,000 |
| 2016 | $3,188 | $162,900 | $23,400 | $139,500 |
| 2015 | $3,188 | $162,900 | $23,400 | $139,500 |
| 2014 | $2,894 | $147,100 | $25,900 | $121,200 |
Source: Public Records
Map
Nearby Homes