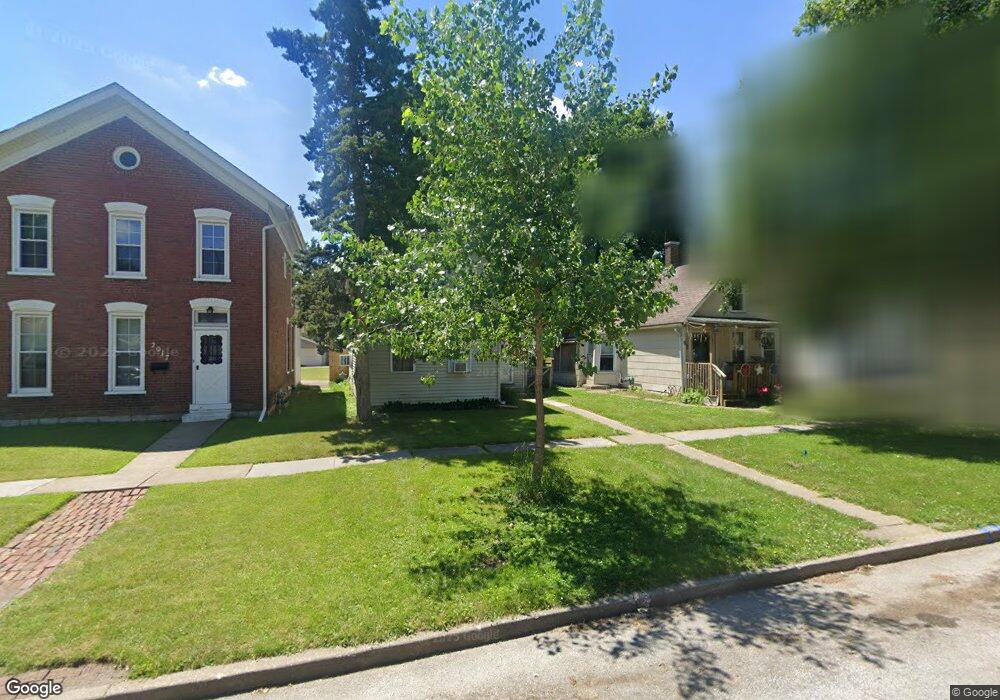
2019 W 2nd St Davenport, IA 52802
West End NeighborhoodEstimated Value: $101,675 - $109,000
3
Beds
2
Baths
1,127
Sq Ft
$92/Sq Ft
Est. Value
About This Home
This home is located at 2019 W 2nd St, Davenport, IA 52802 and is currently estimated at $103,669, approximately $91 per square foot. 2019 W 2nd St is a home located in Scott County with nearby schools including Walnut Hill Elementary School, South Christian Elementary School, and Caverna Middle School.
Ownership History
Date
Name
Owned For
Owner Type
Purchase Details
Closed on
Apr 28, 2010
Sold by
Edwards Kenny and Edwards Angela
Bought by
Bribriesco Angela M and Bribriesco John T
Current Estimated Value
Purchase Details
Closed on
Oct 16, 2009
Sold by
Sanchez Luis E
Bought by
Fifer Jack and Fifer Debra
Home Financials for this Owner
Home Financials are based on the most recent Mortgage that was taken out on this home.
Original Mortgage
$54,000
Interest Rate
4.9%
Mortgage Type
Seller Take Back
Purchase Details
Closed on
Oct 2, 2007
Sold by
Edwards Alice C
Bought by
Deutsche Bank National Trust Co
Purchase Details
Closed on
Mar 31, 2007
Sold by
Ohp 1 L C
Bought by
Voss Ted A and Voss Wendy
Home Financials for this Owner
Home Financials are based on the most recent Mortgage that was taken out on this home.
Original Mortgage
$68,000
Interest Rate
9%
Mortgage Type
Seller Take Back
Create a Home Valuation Report for This Property
The Home Valuation Report is an in-depth analysis detailing your home's value as well as a comparison with similar homes in the area
Home Values in the Area
Average Home Value in this Area
Purchase History
| Date | Buyer | Sale Price | Title Company |
|---|---|---|---|
| Bribriesco Angela M | -- | None Available | |
| Fifer Jack | $54,000 | None Available | |
| Deutsche Bank National Trust Co | $47,409 | None Available | |
| Voss Ted A | $70,000 | None Available |
Source: Public Records
Mortgage History
| Date | Status | Borrower | Loan Amount |
|---|---|---|---|
| Previous Owner | Fifer Jack | $54,000 | |
| Previous Owner | Voss Ted A | $68,000 |
Source: Public Records
Tax History Compared to Growth
Tax History
| Year | Tax Paid | Tax Assessment Tax Assessment Total Assessment is a certain percentage of the fair market value that is determined by local assessors to be the total taxable value of land and additions on the property. | Land | Improvement |
|---|---|---|---|---|
| 2025 | $1,410 | $96,570 | $8,420 | $88,150 |
| 2024 | $2,110 | $78,940 | $8,420 | $70,520 |
| 2023 | $2,073 | $78,940 | $8,420 | $70,520 |
| 2022 | $2,439 | $86,230 | $8,420 | $77,810 |
| 2021 | $1,850 | $86,230 | $8,420 | $77,810 |
| 2020 | $2,330 | $82,530 | $8,420 | $74,110 |
| 2019 | $2,629 | $82,530 | $8,420 | $74,110 |
| 2018 | $2,376 | $82,530 | $8,420 | $74,110 |
| 2017 | $2,272 | $78,820 | $8,420 | $70,400 |
| 2016 | $2,133 | $75,120 | $0 | $0 |
| 2015 | $1,646 | $68,050 | $0 | $0 |
| 2014 | $1,512 | $68,050 | $0 | $0 |
| 2013 | $1,486 | $0 | $0 | $0 |
| 2012 | -- | $66,240 | $7,410 | $58,830 |
Source: Public Records
Map
Nearby Homes
- 2011 W 2nd St
- 2010 W 1st St
- 211 Cedar St
- 2014 Claussen St
- 2006 Claussen St
- 117 S Pine St
- 321 Cedar St
- 120 N Pine St
- 2008 Dixwell St
- 1815 W 3rd St
- 2101 W 5th St
- 131 S Lincoln Ave
- 2312 1/2 W 1st St
- 2312 W 1st St
- 223 S Lincoln Ave
- 2243 W 4th St
- 2024 W 6th St
- 1636 W 3rd St
- 2114 Telegraph Rd
- 1614 W 3rd St