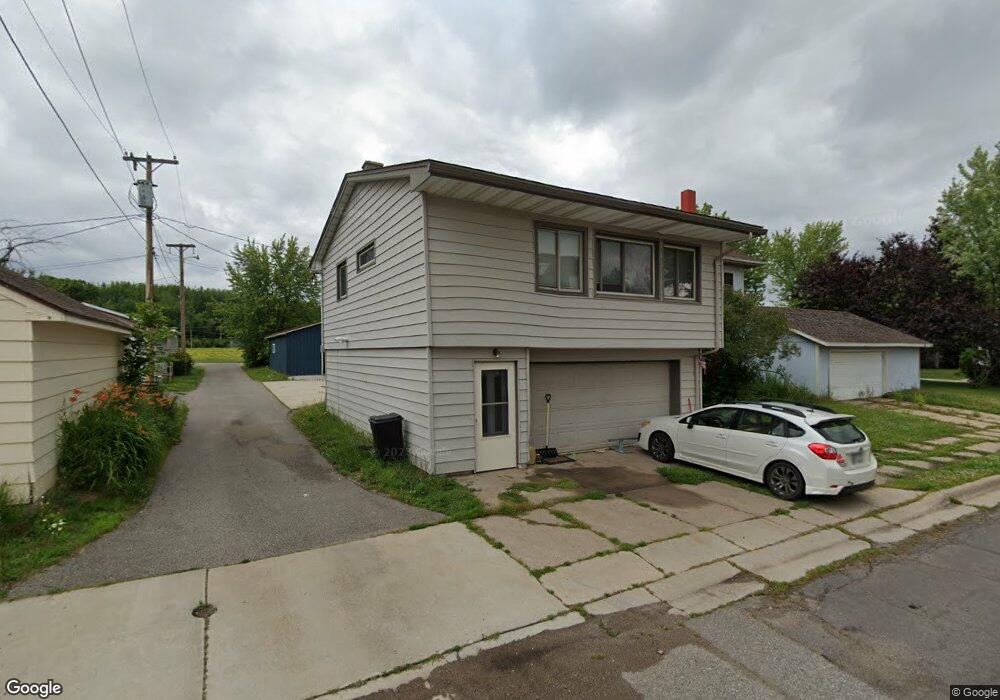
202 1/2 1st St N Biwabik, MN 55708
Estimated Value: $79,000 - $120,000
2
Beds
1
Bath
714
Sq Ft
$149/Sq Ft
Est. Value
About This Home
This home is located at 202 1/2 1st St N, Biwabik, MN 55708 and is currently estimated at $106,333, approximately $148 per square foot. 202 1/2 1st St N is a home located in St. Louis County with nearby schools including Mesabi East Elementary School and Mesabi East Secondary School.
Ownership History
Date
Name
Owned For
Owner Type
Purchase Details
Closed on
Apr 13, 2020
Sold by
Robertson Michael C and Robertson Grover W
Bought by
Robertson Michael C and Robertson Jody
Current Estimated Value
Purchase Details
Closed on
Mar 30, 2020
Sold by
Roberstone Gage K
Bought by
Robertson Mitchel C and Robertson Grover W
Purchase Details
Closed on
Sep 24, 2015
Sold by
Robertson Mitchel C and Robertson Revocable L Grover W
Bought by
Robertson Gage K
Home Financials for this Owner
Home Financials are based on the most recent Mortgage that was taken out on this home.
Original Mortgage
$50,000
Outstanding Balance
$39,392
Interest Rate
4%
Mortgage Type
Seller Take Back
Estimated Equity
$66,941
Purchase Details
Closed on
May 14, 2015
Sold by
Ewens John G
Bought by
Robertson Mitchel C and The Grover W Robertson Revocab
Purchase Details
Closed on
Sep 22, 2004
Sold by
Day William B and Day Maureen E
Bought by
Ewens John G
Create a Home Valuation Report for This Property
The Home Valuation Report is an in-depth analysis detailing your home's value as well as a comparison with similar homes in the area
Home Values in the Area
Average Home Value in this Area
Purchase History
| Date | Buyer | Sale Price | Title Company |
|---|---|---|---|
| Robertson Michael C | -- | None Available | |
| Robertson Mitchel C | -- | None Available | |
| Robertson Gage K | $50,000 | Attorney | |
| Robertson Mitchel C | $40,000 | Attorney | |
| Ewens John G | $23,000 | -- |
Source: Public Records
Mortgage History
| Date | Status | Borrower | Loan Amount |
|---|---|---|---|
| Open | Robertson Gage K | $50,000 |
Source: Public Records
Tax History Compared to Growth
Tax History
| Year | Tax Paid | Tax Assessment Tax Assessment Total Assessment is a certain percentage of the fair market value that is determined by local assessors to be the total taxable value of land and additions on the property. | Land | Improvement |
|---|---|---|---|---|
| 2023 | $134 | $32,400 | $1,300 | $31,100 |
| 2022 | $138 | $27,000 | $1,300 | $25,700 |
| 2021 | $120 | $25,400 | $1,200 | $24,200 |
| 2020 | $120 | $24,500 | $1,200 | $23,300 |
| 2019 | $118 | $24,500 | $1,200 | $23,300 |
| 2018 | $118 | $25,400 | $1,200 | $24,200 |
| 2017 | $128 | $27,200 | $4,300 | $22,900 |
| 2016 | $112 | $29,800 | $4,300 | $25,500 |
| 2015 | $116 | $16,600 | $2,300 | $14,300 |
| 2014 | -- | $17,200 | $2,300 | $14,900 |
Source: Public Records
Map
Nearby Homes
- 400 5th Ave N
- 107 N Creek Dr
- TBD Hwy 135
- 6076 Wynne Ridge Rd
- 5047 Vermilion Trail
- 5610 Birch Bark Landing
- 6047 Voyageurs Trail
- 5618 Birchbark Landing
- 6206 Needleleaf Rd
- 6041 Voyageurs Trail
- 6032 Voyageurs Trail
- TBD Palm Dr
- 39 S Erie St
- 316 W 3rd Ave N
- 311 W 2nd Ave N
- 304 W 3rd Ave N
- 213 & 215 W 4th Ave N
- 6476 Cypress Ln
- 23 W 4th Ave N
- 112 W 3rd Ave N
- 202 3rd Ave N
- Lots 20 & 21 Sunset Cir
- 6129 Voyageurs
- 6605 Voyageurs
- 5624 Birchbark Landing Canyon
- 5625 Birchbark Landing Canyon
- 6615 Voyageurs Trail
- 201 1st St N
- 205 2nd Ave N
- 200 1st St N
- 120 3rd Ave N
- 209 2nd Ave N
- 111 2nd Ave N
- 205 3rd Ave N
- 201 3rd Ave N
- 200 2nd Ave N
- 107 2nd Ave N
- 119 3rd Ave N
- 119 119 N 3rd Ave
- 110 3rd Ave N Biwabik Mn 1