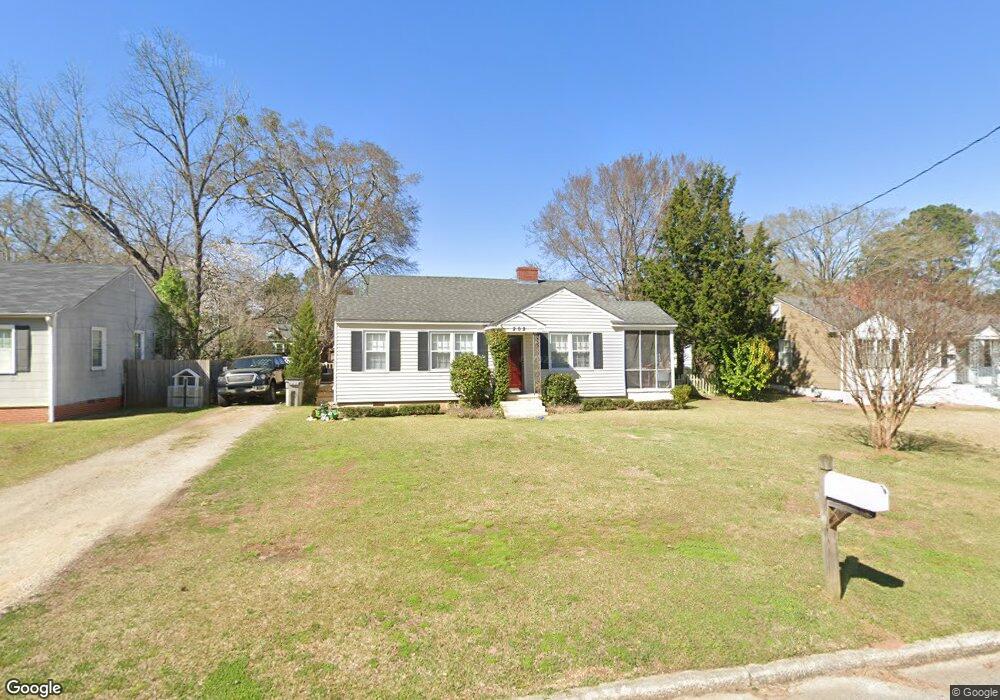
202 Beechwood Cir Lagrange, GA 30240
Estimated Value: $176,829 - $196,000
2
Beds
1
Bath
912
Sq Ft
$207/Sq Ft
Est. Value
About This Home
This home is located at 202 Beechwood Cir, Lagrange, GA 30240 and is currently estimated at $188,457, approximately $206 per square foot. 202 Beechwood Cir is a home located in Troup County with nearby schools including Franklin Forest Elementary School, Hollis Hand Elementary School, and Ethel W. Kight Elementary School.
Ownership History
Date
Name
Owned For
Owner Type
Purchase Details
Closed on
Feb 9, 2001
Sold by
Wyatt Charles Est
Bought by
Benefield Kristy D
Current Estimated Value
Purchase Details
Closed on
Feb 8, 1999
Sold by
Phil Taylor
Bought by
Wyatt Charles Est
Purchase Details
Closed on
Dec 4, 1990
Sold by
Rachel M Jones
Bought by
Phil Taylor
Purchase Details
Closed on
Feb 3, 1986
Bought by
Rachel M Jones
Purchase Details
Closed on
Dec 1, 1985
Sold by
Patricia Woodyu Lee
Purchase Details
Closed on
Feb 1, 1983
Sold by
Wily Woody
Bought by
Patricia Woodyu Lee
Purchase Details
Closed on
Mar 5, 1981
Bought by
Wily Woody
Purchase Details
Closed on
Oct 31, 1974
Sold by
Smith
Purchase Details
Closed on
Jan 1, 1956
Sold by
Alma Ruben and Alma Smith
Bought by
Smith
Create a Home Valuation Report for This Property
The Home Valuation Report is an in-depth analysis detailing your home's value as well as a comparison with similar homes in the area
Purchase History
| Date | Buyer | Sale Price | Title Company |
|---|---|---|---|
| Benefield Kristy D | $73,600 | -- | |
| Wyatt Charles Est | $67,000 | -- | |
| Phil Taylor | $37,000 | -- | |
| Rachel M Jones | -- | -- | |
| -- | $40,000 | -- | |
| Patricia Woodyu Lee | -- | -- | |
| Wily Woody | $23,500 | -- | |
| -- | -- | -- | |
| Smith | -- | -- |
Source: Public Records
Tax History
| Year | Tax Paid | Tax Assessment Tax Assessment Total Assessment is a certain percentage of the fair market value that is determined by local assessors to be the total taxable value of land and additions on the property. | Land | Improvement |
|---|---|---|---|---|
| 2025 | $1,526 | $63,120 | $14,000 | $49,120 |
| 2024 | $1,271 | $48,600 | $18,000 | $30,600 |
| 2023 | $1,275 | $48,720 | $18,000 | $30,720 |
| 2022 | $1,137 | $42,720 | $14,000 | $28,720 |
| 2021 | $1,198 | $41,720 | $14,000 | $27,720 |
| 2020 | $761 | $25,240 | $8,000 | $17,240 |
| 2019 | $736 | $24,400 | $8,000 | $16,400 |
| 2018 | $736 | $24,400 | $8,000 | $16,400 |
| 2017 | $619 | $20,520 | $8,000 | $12,520 |
| 2016 | $606 | $20,107 | $8,000 | $12,107 |
| 2015 | $607 | $20,107 | $8,000 | $12,107 |
| 2014 | $589 | $19,470 | $8,000 | $11,470 |
| 2013 | -- | $20,959 | $8,000 | $12,959 |
Source: Public Records
Map
Nearby Homes
- 222 Beechwood Cir
- 109 Thomas St
- 219 Banks St
- 0 Ridley Ave Unit 10550104
- 609 Ridley Ave
- 707 Ridley Ave
- 611 Ridley Ave
- 615 Ridley Ave
- 709 Ridley Ave
- 900 North St
- 120 Saynor Cir
- 110 Russell St
- 105 Saynor Cir
- 106 Ewing St
- 301 E Bacon St
- 202 Park Hill Dr
- 204 Colonial St
- 724 Camellia Dr
- 705 Piney Woods Dr
- 102 Dogwood Dr
- 200 Beechwood Cir
- 204 Beechwood Cir
- 203 Beechwood Cir
- 201 Beechwood Cir
- 205 Beechwood Cir
- 206 Beechwood Cir
- 103 Elm Dr
- 105 Elm Dr
- 107 Beechwood Cir
- 107 Elm Dr
- 261 Beechwood Cir
- 207 Beechwood Cir
- 101 Elm Dr
- 208 Beechwood Cir
- 259 Beechwood Cir
- 259 Beechwood Cir Unit 7 & 10
- 105 Beechwood Cir
- 209 Beechwood Cir
- 257 Beechwood Cir Unit 11
- 257 Beechwood Cir
Your Personal Tour Guide
Ask me questions while you tour the home.