Estimated Value: $219,000 - $280,000
3
Beds
2
Baths
1,251
Sq Ft
$209/Sq Ft
Est. Value
About This Home
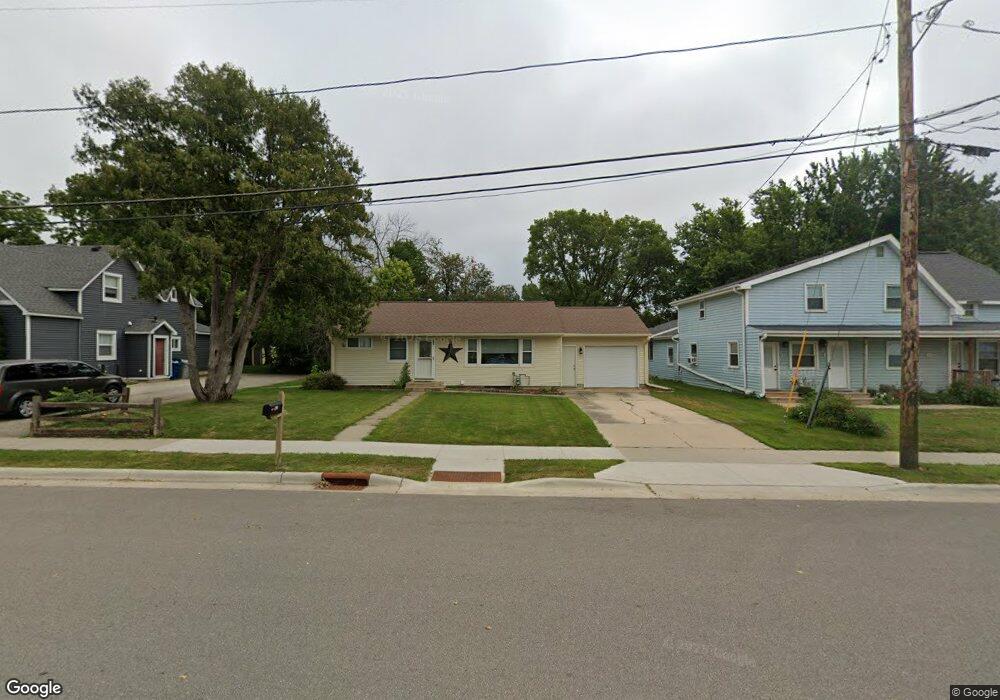
This home is located at 202 Byron Ave N, Byron, MN 55920 and is currently estimated at $261,302, approximately $208 per square foot. 202 Byron Ave N is a home located in Olmsted County with nearby schools including Byron Intermediate School, Byron Middle School, and Byron Senior High School.
Ownership History
Date
Name
Owned For
Owner Type
Purchase Details
Closed on
Nov 19, 2021
Sold by
Moon Nicole
Bought by
Davidson Jason J
Current Estimated Value
Home Financials for this Owner
Home Financials are based on the most recent Mortgage that was taken out on this home.
Original Mortgage
$209,250
Outstanding Balance
$191,715
Interest Rate
2.98%
Mortgage Type
New Conventional
Estimated Equity
$69,587
Purchase Details
Closed on
Mar 31, 2016
Sold by
Jacobson Lynn M and Jacobson Mark
Bought by
Moon Nicole
Home Financials for this Owner
Home Financials are based on the most recent Mortgage that was taken out on this home.
Original Mortgage
$110,805
Interest Rate
3.62%
Mortgage Type
FHA
Purchase Details
Closed on
Jul 14, 2006
Sold by
Vantaggi Reno
Bought by
Griffith Lynn M
Home Financials for this Owner
Home Financials are based on the most recent Mortgage that was taken out on this home.
Original Mortgage
$84,000
Interest Rate
6.82%
Mortgage Type
New Conventional
Create a Home Valuation Report for This Property
The Home Valuation Report is an in-depth analysis detailing your home's value as well as a comparison with similar homes in the area
Home Values in the Area
Average Home Value in this Area
Purchase History
| Date | Buyer | Sale Price | Title Company |
|---|---|---|---|
| Davidson Jason J | $225,000 | Edina Realty Title Inc | |
| Moon Nicole | $112,900 | Home Title Inc | |
| Griffith Lynn M | $110,000 | Rochester Title |
Source: Public Records
Mortgage History
| Date | Status | Borrower | Loan Amount |
|---|---|---|---|
| Open | Davidson Jason J | $209,250 | |
| Previous Owner | Moon Nicole | $110,805 | |
| Previous Owner | Griffith Lynn M | $84,000 |
Source: Public Records
Tax History Compared to Growth
Tax History
| Year | Tax Paid | Tax Assessment Tax Assessment Total Assessment is a certain percentage of the fair market value that is determined by local assessors to be the total taxable value of land and additions on the property. | Land | Improvement |
|---|---|---|---|---|
| 2024 | $3,200 | $211,500 | $30,000 | $181,500 |
| 2023 | $3,046 | $209,500 | $27,000 | $182,500 |
| 2022 | $2,666 | $204,300 | $27,000 | $177,300 |
| 2021 | $2,154 | $156,300 | $27,000 | $129,300 |
| 2020 | $1,786 | $146,700 | $27,000 | $119,700 |
| 2019 | $1,642 | $124,500 | $22,000 | $102,500 |
| 2018 | $1,525 | $117,300 | $22,000 | $95,300 |
| 2017 | $1,504 | $110,700 | $18,000 | $92,700 |
| 2016 | $1,294 | $83,500 | $13,600 | $69,900 |
| 2015 | $621 | $69,700 | $12,800 | $56,900 |
| 2014 | $1,182 | $69,700 | $12,800 | $56,900 |
| 2012 | -- | $71,900 | $12,929 | $58,971 |
Source: Public Records
Map
Nearby Homes
- 403 3rd Ave NE
- 504 3rd Ave NW
- TBD 708th St
- 610 3rd Ave NW
- 423 3rd Ave NW
- 222 7th St NW
- 603 3rd Ave NW
- 519 3rd St NW
- 228 9th St NE
- 942 Byron Ave N
- 328 10th St NW
- 500 9th Ave NW
- 413 9th Ave NW
- 607 9th St NW
- 1005 4th Ave NE
- 1756 (L4,B2) 4th St NE
- 1720 (L1,B2) 4th St NE
- 1890 (L19,B2) 4th St NE
- 1826 (L15,B2) 4th St NE
- 1861 (L8,B1) 4th St NE
- 206 Byron Ave N
- 126 Byron Ave N
- 124 Byron Ave N
- 210 Byron Ave N
- 201 Byron Ave N
- 121 Byron Ave N
- 205 Byron Ave N
- 122 Byron Ave N
- 209 Byron Ave N
- 214 Byron Ave N
- 213 Byron Ave N
- 119 Byron Ave N
- 6 2nd St NW
- 117 Byron Ave N
- 118 Byron Ave N
- 15 15 2nd-Street-nw
- 15 2nd St NW
- 217 Byron Ave N
- 10 2nd St NW
- 210 1st Ave NW