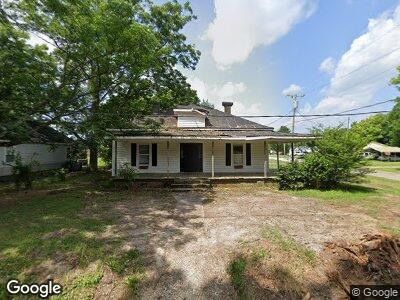
202 Chestnut St Aulander, NC 27805
Estimated Value: $42,224 - $76,000
3
Beds
1
Bath
300
Sq Ft
$191/Sq Ft
Est. Value
About This Home
This home is located at 202 Chestnut St, Aulander, NC 27805 and is currently estimated at $57,306, approximately $191 per square foot. 202 Chestnut St is a home located in Bertie County with nearby schools including Aulander Elementary School, Bertie Middle School, and Bertie High.
Ownership History
Date
Name
Owned For
Owner Type
Purchase Details
Closed on
Oct 24, 2023
Sold by
Lassiter Randy C and Lassiter Lynn U
Bought by
Wilder Steven M and Wilder Donna
Current Estimated Value
Home Financials for this Owner
Home Financials are based on the most recent Mortgage that was taken out on this home.
Original Mortgage
$20,000
Outstanding Balance
$12,990
Interest Rate
7.49%
Mortgage Type
New Conventional
Estimated Equity
$44,101
Purchase Details
Closed on
Jul 17, 2012
Sold by
Holley Selinda and Flores Jesus
Bought by
Lassiter Randy C
Purchase Details
Closed on
Apr 3, 2009
Sold by
Flores Jesus and Flores Catherine
Bought by
Holley Selinda
Home Financials for this Owner
Home Financials are based on the most recent Mortgage that was taken out on this home.
Original Mortgage
$23,500
Interest Rate
5.14%
Mortgage Type
Seller Take Back
Create a Home Valuation Report for This Property
The Home Valuation Report is an in-depth analysis detailing your home's value as well as a comparison with similar homes in the area
Home Values in the Area
Average Home Value in this Area
Purchase History
| Date | Buyer | Sale Price | Title Company |
|---|---|---|---|
| Wilder Steven M | $20,000 | None Listed On Document | |
| Lassiter Randy C | -- | None Available | |
| Holley Selinda | $25,000 | -- |
Source: Public Records
Mortgage History
| Date | Status | Borrower | Loan Amount |
|---|---|---|---|
| Open | Wilder Steven M | $20,000 | |
| Closed | Wilder Steven M | $20,000 | |
| Previous Owner | Holley Selinda | $23,500 |
Source: Public Records
Tax History Compared to Growth
Tax History
| Year | Tax Paid | Tax Assessment Tax Assessment Total Assessment is a certain percentage of the fair market value that is determined by local assessors to be the total taxable value of land and additions on the property. | Land | Improvement |
|---|---|---|---|---|
| 2024 | $298 | $17,052 | $7,544 | $9,508 |
| 2023 | $298 | $17,052 | $7,544 | $9,508 |
| 2022 | $277 | $17,052 | $7,544 | $9,508 |
| 2021 | $277 | $17,052 | $7,544 | $9,508 |
| 2020 | $277 | $17,052 | $7,544 | $9,508 |
| 2019 | $214 | $13,162 | $5,495 | $7,667 |
| 2018 | $209 | $13,162 | $5,495 | $7,667 |
| 2017 | $209 | $13,162 | $5,495 | $7,667 |
| 2016 | $209 | $13,162 | $5,495 | $7,667 |
| 2015 | $662 | $13,162 | $5,495 | $7,667 |
| 2014 | $662 | $13,162 | $5,495 | $7,667 |
| 2013 | $662 | $13,162 | $5,495 | $7,667 |
Source: Public Records
Map
Nearby Homes
- 313 W Main St
- 101 W Pearl St
- 301 S Commerce St
- 305 Clyde
- 815 S Commerce St
- 410 E Main St
- 201 Nc Highway 305
- 137 Ray Farmer Rd
- 224 Millennium Rd Unit B
- 801 Saint John Millennium Rd
- 241 Joe Phelps Rd
- 105 Hollowell Rd
- Lot 5 Somerset Dr
- 451 Rawls Rd
- 442 Mill Branch Church Rd
- 0 Moore Rd
- 447 S Early Station Rd
- 118 Wheeler Rd
- 1343 Nc Highway 561 W
- 1625 Nc Highway 461