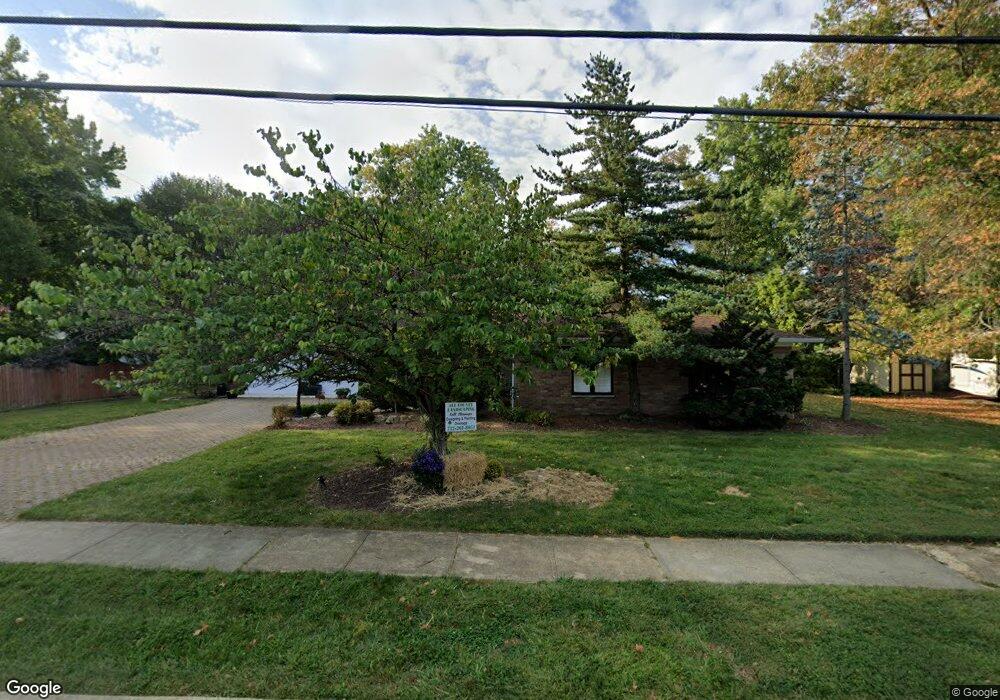
202 Church St Matawan, NJ 07747
Estimated Value: $648,000 - $720,455
3
Beds
2
Baths
1,649
Sq Ft
$417/Sq Ft
Est. Value
About This Home
This home is located at 202 Church St, Matawan, NJ 07747 and is currently estimated at $688,364, approximately $417 per square foot. 202 Church St is a home located in Monmouth County with nearby schools including Matawan Reg High School, St Benedict School, and St. Joseph Elementary School.
Ownership History
Date
Name
Owned For
Owner Type
Purchase Details
Closed on
Nov 3, 2006
Sold by
Cinquegrana Susan
Bought by
Marcus Jerrold
Current Estimated Value
Home Financials for this Owner
Home Financials are based on the most recent Mortgage that was taken out on this home.
Original Mortgage
$310,000
Outstanding Balance
$185,217
Interest Rate
6.39%
Estimated Equity
$503,147
Purchase Details
Closed on
May 31, 2002
Sold by
Lamanna Ann
Bought by
Cinquegrana Susan and Morgillo Joann
Home Financials for this Owner
Home Financials are based on the most recent Mortgage that was taken out on this home.
Original Mortgage
$220,000
Interest Rate
6.73%
Create a Home Valuation Report for This Property
The Home Valuation Report is an in-depth analysis detailing your home's value as well as a comparison with similar homes in the area
Home Values in the Area
Average Home Value in this Area
Purchase History
| Date | Buyer | Sale Price | Title Company |
|---|---|---|---|
| Marcus Jerrold | $490,000 | -- | |
| Cinquegrana Susan | $284,900 | -- |
Source: Public Records
Mortgage History
| Date | Status | Borrower | Loan Amount |
|---|---|---|---|
| Open | Marcus Jerrold | $310,000 | |
| Previous Owner | Cinquegrana Susan | $220,000 |
Source: Public Records
Tax History Compared to Growth
Tax History
| Year | Tax Paid | Tax Assessment Tax Assessment Total Assessment is a certain percentage of the fair market value that is determined by local assessors to be the total taxable value of land and additions on the property. | Land | Improvement |
|---|---|---|---|---|
| 2025 | $12,563 | $688,400 | $408,000 | $280,400 |
| 2024 | $12,224 | $621,600 | $346,400 | $275,200 |
| 2023 | $12,224 | $571,500 | $302,700 | $268,800 |
| 2022 | $12,050 | $495,500 | $239,300 | $256,200 |
| 2021 | $12,050 | $445,800 | $217,900 | $227,900 |
| 2020 | $12,202 | $449,600 | $226,900 | $222,700 |
| 2019 | $12,173 | $435,700 | $214,300 | $221,400 |
| 2018 | $11,641 | $417,700 | $206,600 | $211,100 |
| 2017 | $10,808 | $393,300 | $188,600 | $204,700 |
| 2016 | $10,076 | $382,700 | $183,200 | $199,500 |
| 2015 | $10,530 | $383,900 | $189,500 | $194,400 |
| 2014 | $10,074 | $374,500 | $181,400 | $193,100 |
Source: Public Records
Map
Nearby Homes