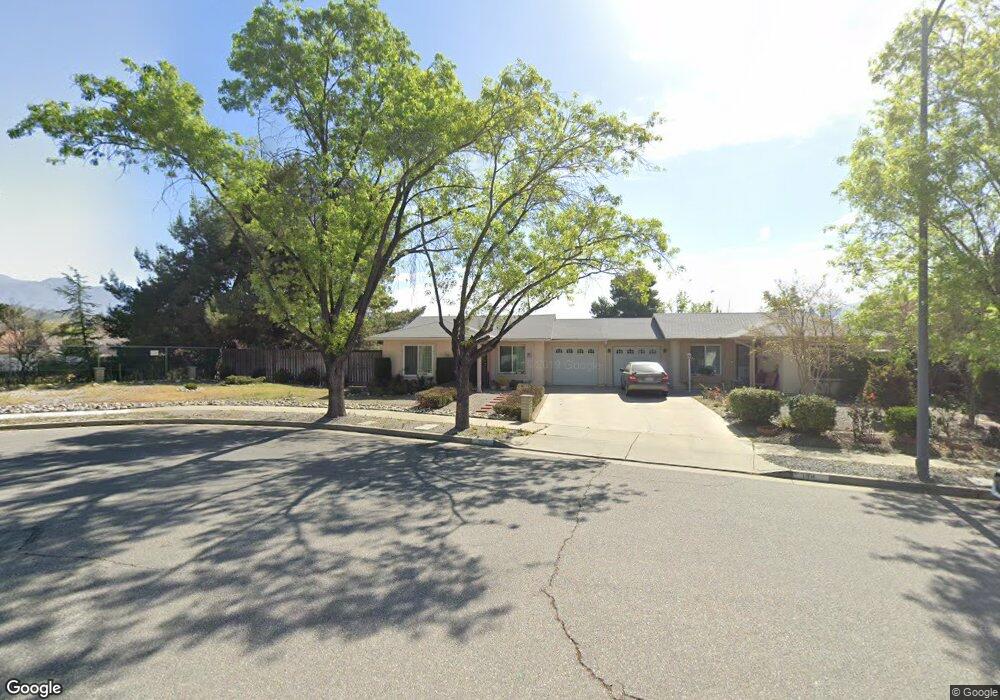
202 Clair Ct Banning, CA 92220
Estimated Value: $247,000 - $286,000
2
Beds
1
Bath
891
Sq Ft
$300/Sq Ft
Est. Value
About This Home
This home is located at 202 Clair Ct, Banning, CA 92220 and is currently estimated at $267,698, approximately $300 per square foot. 202 Clair Ct is a home located in Riverside County with nearby schools including Sundance Elementary School, San Gorgonio Middle School, and Beaumont Senior High School.
Ownership History
Date
Name
Owned For
Owner Type
Purchase Details
Closed on
May 17, 2010
Sold by
Cannizzo Nadine
Bought by
Cannizzo Nadine and Wasseq Ghulam M
Current Estimated Value
Purchase Details
Closed on
Oct 26, 2004
Sold by
Aston Everett
Bought by
Cannizzo Nadine
Purchase Details
Closed on
Jul 12, 2003
Sold by
Aston Erlene M Reed
Bought by
Aston Erlene M Reed
Purchase Details
Closed on
Mar 21, 2003
Sold by
Aston Erlene
Bought by
The Erlene M Reed Aston Living Trust
Purchase Details
Closed on
Aug 16, 2002
Sold by
Leavelle Grave
Bought by
Aston Erlene
Purchase Details
Closed on
Aug 9, 2002
Sold by
Leavelle John H and Leavelle Helen
Bought by
Leavelle Grace
Purchase Details
Closed on
Jun 25, 1999
Sold by
Leavelle John H and Leavelle Larry G
Bought by
Leavelle John H and Leavelle Larry G
Purchase Details
Closed on
Jan 15, 1998
Sold by
Grace Leavelle
Bought by
Leavelle John H and Leavelle Larry G
Create a Home Valuation Report for This Property
The Home Valuation Report is an in-depth analysis detailing your home's value as well as a comparison with similar homes in the area
Home Values in the Area
Average Home Value in this Area
Purchase History
| Date | Buyer | Sale Price | Title Company |
|---|---|---|---|
| Cannizzo Nadine | $50,000 | None Available | |
| Cannizzo Nadine | $125,000 | Southland Title | |
| Aston Erlene M Reed | -- | Alliance Title Company | |
| The Erlene M Reed Aston Living Trust | -- | -- | |
| Aston Erlene | $72,500 | Multiple | |
| Leavelle Grace | -- | Gateway Title Company | |
| Leavelle John H | -- | -- | |
| Leavelle John H | -- | -- |
Source: Public Records
Tax History
| Year | Tax Paid | Tax Assessment Tax Assessment Total Assessment is a certain percentage of the fair market value that is determined by local assessors to be the total taxable value of land and additions on the property. | Land | Improvement |
|---|---|---|---|---|
| 2025 | $1,351 | $108,407 | $29,634 | $78,773 |
| 2023 | $1,351 | $104,199 | $28,484 | $75,715 |
| 2022 | $1,327 | $102,157 | $27,926 | $74,231 |
| 2021 | $1,301 | $100,155 | $27,379 | $72,776 |
| 2020 | $1,285 | $99,129 | $27,099 | $72,030 |
| 2019 | $1,263 | $97,186 | $26,568 | $70,618 |
| 2018 | $1,256 | $95,282 | $26,048 | $69,234 |
| 2017 | $1,233 | $93,415 | $25,538 | $67,877 |
| 2016 | $1,199 | $91,585 | $25,038 | $66,547 |
| 2015 | $1,178 | $90,212 | $24,663 | $65,549 |
| 2014 | $1,177 | $88,447 | $24,181 | $64,266 |
Source: Public Records
Map
Nearby Homes
- 217 Beverly Dr
- 5388 C St
- 724 Kingswell Ave
- 5478 Evelyn Dr
- 5242 C St
- 4912 Corral Cir
- 300 Apex Ave
- 298 Apex Ave
- 401 Marian Way
- 5362 W Hoffer St
- 5392 W Hoffer St
- 5367 W Hoffer St
- 968 Mahogany St
- 5370 Echo Dr
- 5422 Echo Dr
- 5760 W Ramsey St
- 1022 Mahogany St
- 959 Rockcress Ln
- 5700 W Wilson St Unit 1
- 5700 W Wilson St Unit 51
Your Personal Tour Guide
Ask me questions while you tour the home.