
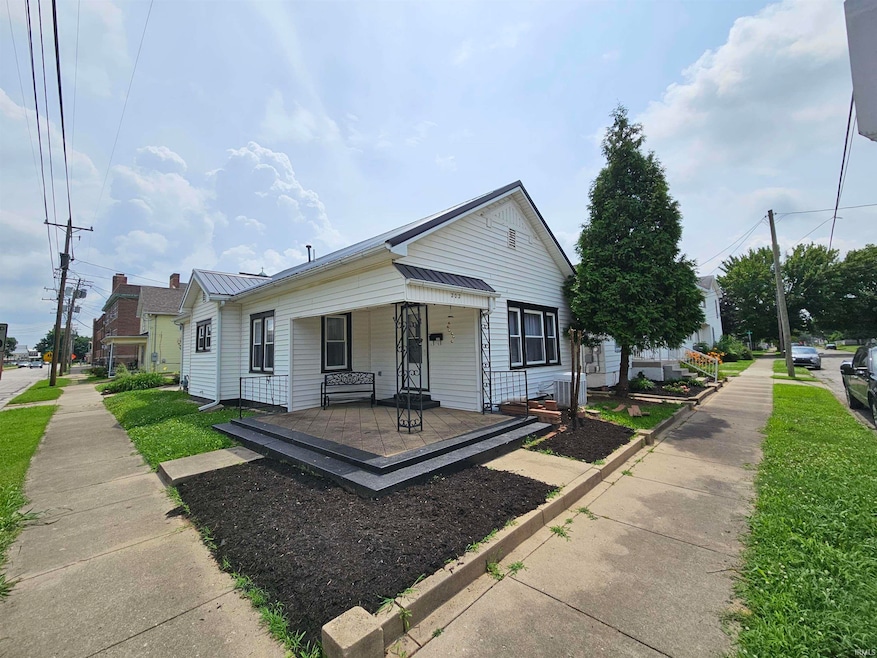
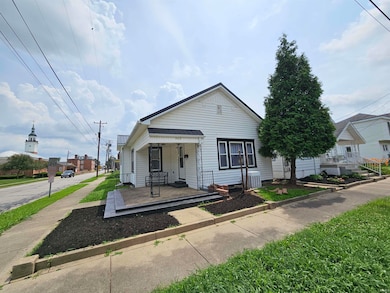
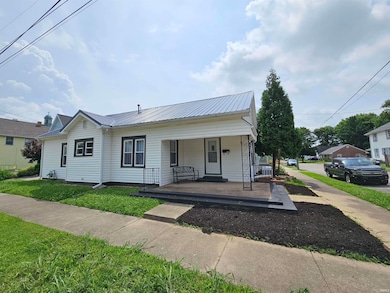
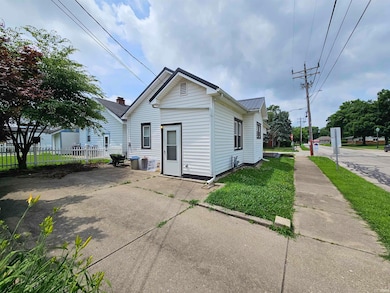
202 Dubois St Vincennes, IN 47591
Estimated payment $666/month
Total Views
1,365
2
Beds
1
Bath
992
Sq Ft
$111
Price per Sq Ft
Highlights
- The property is located in a historic district
- Corner Lot
- Formal Dining Room
- Wood Flooring
- Covered patio or porch
- 1-minute walk to George Rogers Clark National Historical Park
About This Home
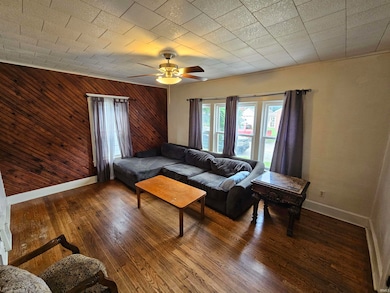
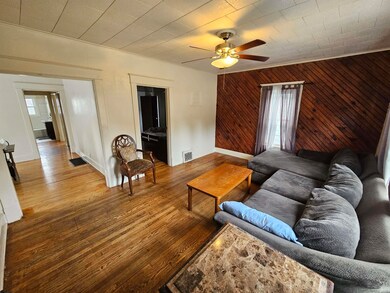
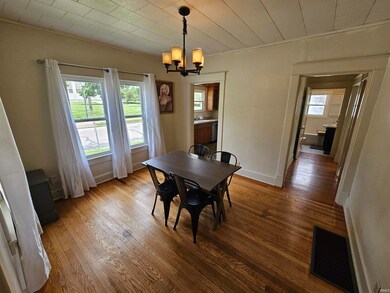
Check out this home with the best kitchen window view of Vincennes! This 2 bedroom home has tons of great features including original hardwood floors, formal dining room, updated vinyl windows, Stainless Steel Kitchen appliances and a breakfast nook with built in cabinetry. The property has off street parking, an unfinished basement that is great for extra storage, and a covered front porch that could fit you and your friends comfortably for the 4th of July Fireworks! The location here is excellent, directly across from the largest national monument outside of Washington, D.C., The George Rogers Clark Memorial. You are also walking distance to Indiana's first Main Street, the hospital, the Riverwalk, and the Farmer's Market!
Listing Agent
KLEIN RLTY&AUCTION, INC. Brokerage Phone: 812-890-1827 Listed on: 06/18/2025
Home Details
Home Type
- Single Family
Est. Annual Taxes
- $683
Year Built
- Built in 1915
Lot Details
- 2,614 Sq Ft Lot
- Corner Lot
- Level Lot
Parking
- Driveway
Home Design
- Bungalow
- Asphalt Roof
- Vinyl Construction Material
Interior Spaces
- 1-Story Property
- Ceiling Fan
- Formal Dining Room
- Eat-In Kitchen
- Washer and Electric Dryer Hookup
- Partially Finished Basement
Flooring
- Wood
- Vinyl
Bedrooms and Bathrooms
- 2 Bedrooms
- 1 Full Bathroom
- Bathtub with Shower
Eco-Friendly Details
- Energy-Efficient Appliances
- Energy-Efficient HVAC
Outdoor Features
- Covered patio or porch
Location
- Suburban Location
- The property is located in a historic district
Schools
- Tecumseh-Harrison Elementary School
- Clark Middle School
- Lincoln High School
Utilities
- Forced Air Heating and Cooling System
- High-Efficiency Furnace
- Heating System Uses Gas
- ENERGY STAR Qualified Water Heater
- Cable TV Available
Community Details
- Old Town Subdivision
Listing and Financial Details
- Assessor Parcel Number 42-12-21-302-028.000-022
Map
Create a Home Valuation Report for This Property
The Home Valuation Report is an in-depth analysis detailing your home's value as well as a comparison with similar homes in the area
Home Values in the Area
Average Home Value in this Area
Tax History
| Year | Tax Paid | Tax Assessment Tax Assessment Total Assessment is a certain percentage of the fair market value that is determined by local assessors to be the total taxable value of land and additions on the property. | Land | Improvement |
|---|---|---|---|---|
| 2024 | $683 | $68,500 | $2,900 | $65,600 |
| 2023 | $627 | $67,400 | $2,500 | $64,900 |
| 2022 | $551 | $65,500 | $2,500 | $63,000 |
| 2021 | $482 | $54,000 | $2,500 | $51,500 |
| 2020 | $740 | $36,100 | $2,500 | $33,600 |
| 2019 | $744 | $35,500 | $2,400 | $33,100 |
| 2018 | $751 | $35,900 | $2,400 | $33,500 |
| 2017 | $760 | $36,200 | $2,400 | $33,800 |
| 2016 | $788 | $37,600 | $2,400 | $35,200 |
| 2014 | $832 | $40,700 | $2,400 | $38,300 |
| 2013 | $815 | $39,500 | $300 | $39,200 |
Source: Public Records
Property History
| Date | Event | Price | Change | Sq Ft Price |
|---|---|---|---|---|
| 06/21/2025 06/21/25 | Pending | -- | -- | -- |
| 06/18/2025 06/18/25 | For Sale | $109,900 | -- | $111 / Sq Ft |
Source: Indiana Regional MLS
Purchase History
| Date | Type | Sale Price | Title Company |
|---|---|---|---|
| Grant Deed | $77,000 | Regional Title Svcs Llc | |
| Deed | $32,000 | David L Miller |
Source: Public Records
Mortgage History
| Date | Status | Loan Amount | Loan Type |
|---|---|---|---|
| Open | $73,150 | Construction |
Source: Public Records
About the Listing Agent
Tyler Simmons is a native of Salem, Illinois, and has been a Vincennes resident for the last 15 years. Tyler is an alumnus of Vincennes University's Business Program and Construction Management program. Tyler has been in retail sales since he was 16 years old. He started in Real Estate in 2011, and has averaged over 50 closed transactions per year for the last 10 years. He has also expanded his real estate education to hold 6 designations. He is a CRS (Certified Residential Specialist), which
Tyler's Other Listings
Source: Indiana Regional MLS
MLS Number: 202523349
APN: 42-12-21-302-028.000-022
Disclaimer: Certain information contained herein is derived from information provided by parties other than Homes.com. All information provided is deemed reliable, but is not guaranteed to be accurate and should be independently verified.
![]() IDX information is provided exclusively for personal, non-commercial use, and may not be used for any purpose other than to identify prospective properties consumers may be interested in purchasing. Information is deemed reliable but not guaranteed.
IDX information is provided exclusively for personal, non-commercial use, and may not be used for any purpose other than to identify prospective properties consumers may be interested in purchasing. Information is deemed reliable but not guaranteed.
Nearby Homes