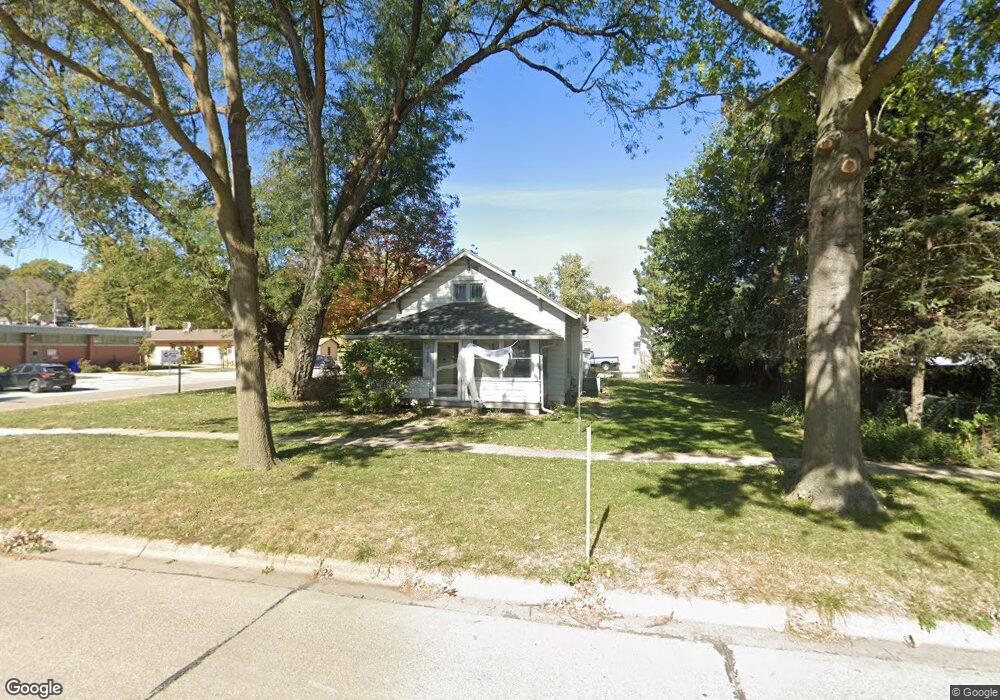
202 E 20th Ave Bellevue, NE 68005
Estimated Value: $179,000 - $192,000
2
Beds
1
Bath
835
Sq Ft
$221/Sq Ft
Est. Value
About This Home
This home is located at 202 E 20th Ave, Bellevue, NE 68005 and is currently estimated at $184,344, approximately $220 per square foot. 202 E 20th Ave is a home located in Sarpy County with nearby schools including Bertha Barber Elementary School, Bellevue Mission Middle School, and Bellevue East High School.
Ownership History
Date
Name
Owned For
Owner Type
Purchase Details
Closed on
May 7, 2020
Sold by
Porter Lisa M
Bought by
Jacob Rachel and Hall Nicholas
Current Estimated Value
Home Financials for this Owner
Home Financials are based on the most recent Mortgage that was taken out on this home.
Original Mortgage
$116,400
Outstanding Balance
$102,951
Interest Rate
3.2%
Mortgage Type
New Conventional
Estimated Equity
$81,393
Purchase Details
Closed on
Jul 24, 2015
Sold by
Smith Dennis F and Smith Catherine M
Bought by
Porter Lisa M
Purchase Details
Closed on
Feb 25, 2004
Sold by
Smith Dennis F and Smith Jill E
Bought by
Smith Dennis F and Smith Catherine
Home Financials for this Owner
Home Financials are based on the most recent Mortgage that was taken out on this home.
Original Mortgage
$88,000
Interest Rate
5.68%
Mortgage Type
VA
Create a Home Valuation Report for This Property
The Home Valuation Report is an in-depth analysis detailing your home's value as well as a comparison with similar homes in the area
Home Values in the Area
Average Home Value in this Area
Purchase History
| Date | Buyer | Sale Price | Title Company |
|---|---|---|---|
| Jacob Rachel | $120,000 | Midwest Title Inc | |
| Porter Lisa M | $88,000 | Titlecore National Llc | |
| Smith Dennis F | $88,000 | Homeland Title |
Source: Public Records
Mortgage History
| Date | Status | Borrower | Loan Amount |
|---|---|---|---|
| Open | Jacob Rachel | $116,400 | |
| Previous Owner | Smith Dennis F | $88,000 |
Source: Public Records
Tax History
| Year | Tax Paid | Tax Assessment Tax Assessment Total Assessment is a certain percentage of the fair market value that is determined by local assessors to be the total taxable value of land and additions on the property. | Land | Improvement |
|---|---|---|---|---|
| 2025 | $2,609 | $165,989 | $31,000 | $134,989 |
| 2024 | $2,807 | $148,905 | $26,000 | $122,905 |
| 2023 | $2,807 | $132,929 | $26,000 | $106,929 |
| 2022 | $2,490 | $115,712 | $21,000 | $94,712 |
| 2021 | $2,364 | $108,672 | $19,000 | $89,672 |
| 2020 | $2,253 | $103,266 | $19,000 | $84,266 |
| 2019 | $2,205 | $101,659 | $19,000 | $82,659 |
| 2018 | $2,042 | $96,688 | $19,000 | $77,688 |
| 2017 | $1,986 | $93,380 | $19,000 | $74,380 |
| 2016 | $1,872 | $89,984 | $19,000 | $70,984 |
| 2015 | $1,799 | $86,989 | $19,000 | $67,989 |
| 2014 | $1,786 | $85,808 | $19,000 | $66,808 |
| 2012 | -- | $96,134 | $19,000 | $77,134 |
Source: Public Records
Map
Nearby Homes
- 2004 Main St
- 1908 Warren St
- 1801 Hancock St
- 104 Waldo Cir
- 307 E 17th Ave
- 1701 Jefferson St
- 2309 Main St
- 1404 Warren St
- 411 W 22nd Ave
- 2405 Hancock St
- 2010 Jackson St
- 2303 Madison St
- 2510 Franklin St
- 2519 Hancock St
- 1807 Collins Dr
- 2504 Washington St
- 2411 Madison St
- 2306 Jackson St
- 1405 Freeman Dr
- 1105 Kountze Memorial Dr
Your Personal Tour Guide
Ask me questions while you tour the home.