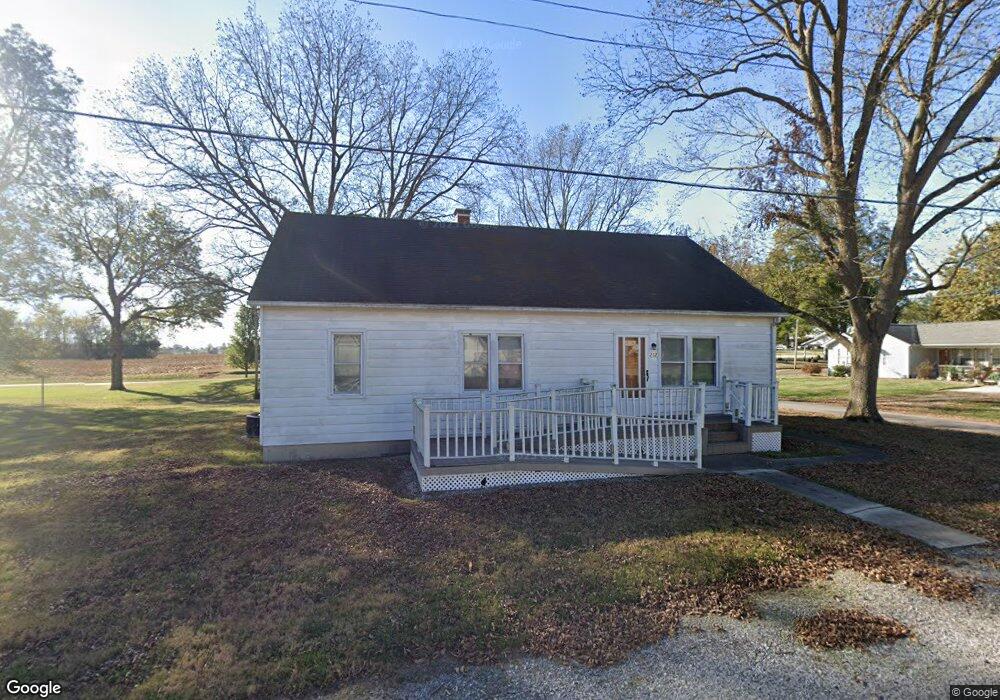
202 E 3rd St Aviston, IL 62216
Estimated Value: $141,000 - $213,000
3
Beds
1
Bath
1,771
Sq Ft
$97/Sq Ft
Est. Value
About This Home
This home is located at 202 E 3rd St, Aviston, IL 62216 and is currently estimated at $172,190, approximately $97 per square foot. 202 E 3rd St is a home located in Clinton County with nearby schools including Aviston Elementary School, Central Community High School, and All Saints Academy.
Ownership History
Date
Name
Owned For
Owner Type
Purchase Details
Closed on
Mar 6, 2024
Sold by
Ottenschnieder Allen
Bought by
Tebbe John and Peek Tyler
Current Estimated Value
Home Financials for this Owner
Home Financials are based on the most recent Mortgage that was taken out on this home.
Original Mortgage
$98,000
Outstanding Balance
$96,722
Interest Rate
7.9%
Mortgage Type
New Conventional
Estimated Equity
$75,468
Purchase Details
Closed on
Feb 24, 2006
Sold by
Molitor John Paul and Molitor Urban Maureen
Bought by
Ottenschnieder Allen
Home Financials for this Owner
Home Financials are based on the most recent Mortgage that was taken out on this home.
Original Mortgage
$76,500
Interest Rate
6.7%
Mortgage Type
Future Advance Clause Open End Mortgage
Create a Home Valuation Report for This Property
The Home Valuation Report is an in-depth analysis detailing your home's value as well as a comparison with similar homes in the area
Purchase History
| Date | Buyer | Sale Price | Title Company |
|---|---|---|---|
| Tebbe John | $120,000 | None Available | |
| Ottenschnieder Allen | $15,000 | Title And Escrow Co Inc | |
| Molitor John Paul | -- | Title And Escrow Plus Inc |
Source: Public Records
Mortgage History
| Date | Status | Borrower | Loan Amount |
|---|---|---|---|
| Open | Tebbe John | $98,000 | |
| Previous Owner | Molitor John Paul | $76,500 |
Source: Public Records
Tax History
| Year | Tax Paid | Tax Assessment Tax Assessment Total Assessment is a certain percentage of the fair market value that is determined by local assessors to be the total taxable value of land and additions on the property. | Land | Improvement |
|---|---|---|---|---|
| 2024 | $2,318 | $42,070 | $9,720 | $32,350 |
| 2023 | $2,318 | $39,690 | $9,170 | $30,520 |
| 2022 | $2,216 | $31,860 | $8,270 | $23,590 |
| 2021 | $1,573 | $30,350 | $7,880 | $22,470 |
| 2020 | $1,555 | $29,190 | $7,580 | $21,610 |
| 2019 | $1,541 | $29,190 | $7,580 | $21,610 |
| 2018 | $2,596 | $43,134 | $7,791 | $35,343 |
| 2017 | $2,527 | $41,080 | $7,420 | $33,660 |
| 2016 | $2,534 | $41,080 | $7,420 | $33,660 |
| 2015 | $1,637 | $41,080 | $7,420 | $33,660 |
| 2013 | $1,637 | $31,360 | $7,420 | $23,940 |
Source: Public Records
Map
Nearby Homes
- 15 Rosewood Ln
- 51 W Logan St
- 4650 Wyatt Way
- 12702 Crestview Ln
- 12746 Rolling Hills Dr
- 8011 von Bokel Dr
- 3265 Venhaus Rd
- 1144 Emily Ln
- 3337 Heavenly Dr
- 630 Wedgewood Ln
- 501 Wedgewood Ln
- 525 Wedgewood Ln
- 607 Wedgewood Ln
- 619 Wedgewood Ln
- 437 Galen Dr
- 679 Galen Dr
- 265 N 1st St
- 1251 Sunset Dr
- 436 N Olive St
- 337 N 2nd St
Your Personal Tour Guide
Ask me questions while you tour the home.