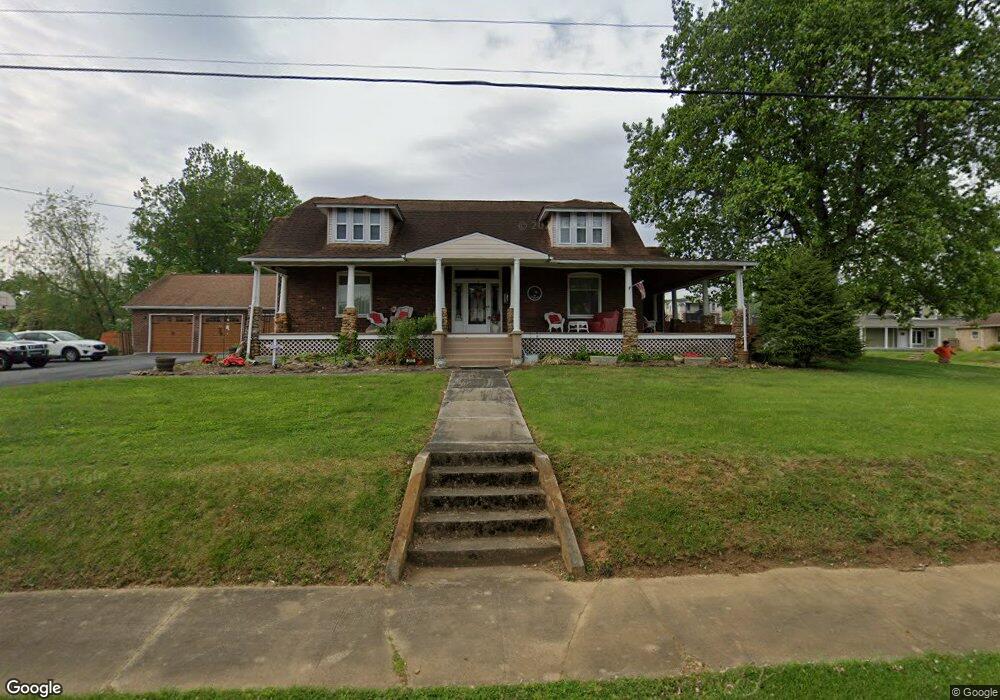
202 E G St Elizabethton, TN 37643
Estimated Value: $357,000 - $444,000
4
Beds
2
Baths
2,700
Sq Ft
$151/Sq Ft
Est. Value
About This Home
This home is located at 202 E G St, Elizabethton, TN 37643 and is currently estimated at $406,484, approximately $150 per square foot. 202 E G St is a home located in Carter County with nearby schools including Elizabethton High School and East Tn Christian Home & Academy.
Ownership History
Date
Name
Owned For
Owner Type
Purchase Details
Closed on
Aug 7, 2003
Sold by
Garland Christopher A
Bought by
Hill Darryl L
Current Estimated Value
Home Financials for this Owner
Home Financials are based on the most recent Mortgage that was taken out on this home.
Original Mortgage
$128,000
Interest Rate
5.42%
Purchase Details
Closed on
Apr 18, 1997
Sold by
Webb Jeanetta B
Bought by
Garland Kaye
Purchase Details
Closed on
Jan 28, 1997
Bought by
Garland Kay Webb Christopher A Garland
Purchase Details
Closed on
Jan 27, 1986
Bought by
Webb Jeanetta B
Create a Home Valuation Report for This Property
The Home Valuation Report is an in-depth analysis detailing your home's value as well as a comparison with similar homes in the area
Purchase History
| Date | Buyer | Sale Price | Title Company |
|---|---|---|---|
| Hill Darryl L | $160,000 | -- | |
| Garland Kaye | $44,100 | -- | |
| Garland Kay Webb Christopher A Garland | $44,100 | -- | |
| Webb Jeanetta B | $38,000 | -- |
Source: Public Records
Mortgage History
| Date | Status | Borrower | Loan Amount |
|---|---|---|---|
| Closed | Webb Jeanetta B | $128,000 |
Source: Public Records
Tax History
| Year | Tax Paid | Tax Assessment Tax Assessment Total Assessment is a certain percentage of the fair market value that is determined by local assessors to be the total taxable value of land and additions on the property. | Land | Improvement |
|---|---|---|---|---|
| 2025 | -- | $80,775 | $16,750 | $64,025 |
| 2024 | -- | $80,775 | $16,750 | $64,025 |
| 2023 | $2,666 | $80,775 | $0 | $0 |
| 2022 | $2,908 | $80,775 | $16,750 | $64,025 |
| 2021 | $1,640 | $80,775 | $16,750 | $64,025 |
| 2020 | $2,657 | $80,775 | $16,750 | $64,025 |
| 2019 | $2,657 | $61,500 | $10,725 | $50,775 |
| 2018 | $2,620 | $61,500 | $10,725 | $50,775 |
| 2017 | $2,620 | $61,500 | $10,725 | $50,775 |
| 2016 | $2,608 | $61,500 | $10,725 | $50,775 |
| 2015 | $2,614 | $61,500 | $10,725 | $50,775 |
| 2014 | $2,323 | $54,400 | $10,725 | $43,675 |
Source: Public Records
Map
Nearby Homes