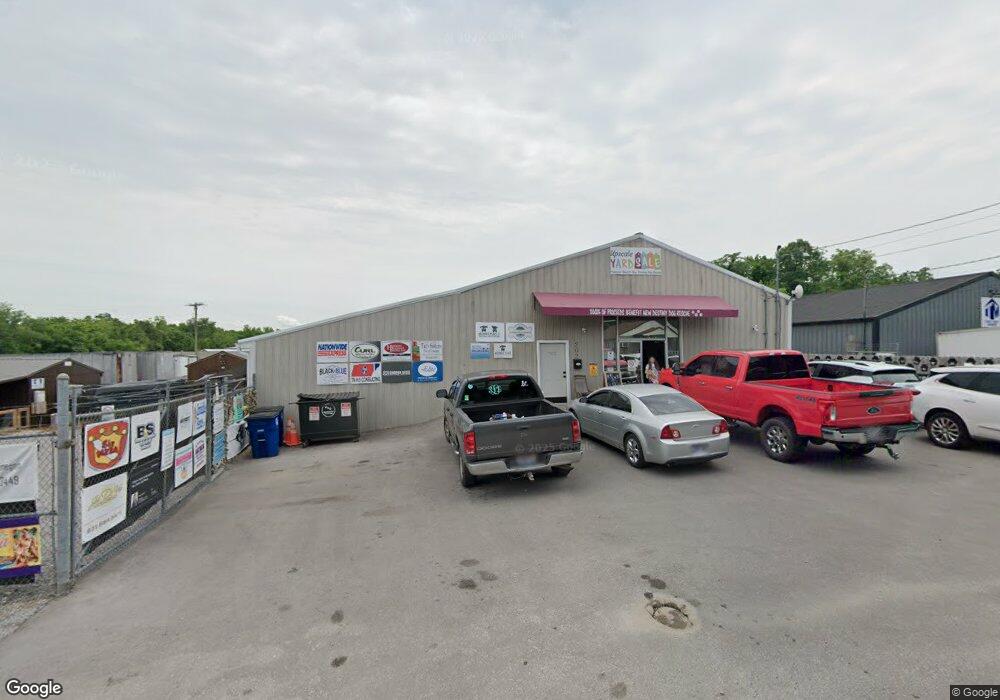
202 E Highland Ave Shelbyville, TN 37160
Estimated Value: $196,324
--
Bed
--
Bath
2,600
Sq Ft
$76/Sq Ft
Est. Value
About This Home
This home is located at 202 E Highland Ave, Shelbyville, TN 37160 and is currently estimated at $196,324, approximately $75 per square foot. 202 E Highland Ave is a home located in Bedford County with nearby schools including Harris Middle School, Victory Baptist Academy, and Christian Chapel Academy.
Ownership History
Date
Name
Owned For
Owner Type
Purchase Details
Closed on
Aug 14, 2020
Sold by
Landers Tyler and Williams Jason
Bought by
New Destiny Dog Rescue
Current Estimated Value
Home Financials for this Owner
Home Financials are based on the most recent Mortgage that was taken out on this home.
Original Mortgage
$112,500
Outstanding Balance
$99,795
Interest Rate
3%
Mortgage Type
New Conventional
Estimated Equity
$96,529
Purchase Details
Closed on
Oct 29, 2012
Sold by
Kelton Joan
Bought by
Landers Tyler and Williams Jason
Purchase Details
Closed on
Jul 14, 2006
Bought by
Kelton Herbert
Purchase Details
Closed on
Aug 4, 1994
Bought by
Hardison Jerry A
Purchase Details
Closed on
Mar 19, 1993
Bought by
Kelton Herbert
Purchase Details
Closed on
Jun 4, 1987
Bought by
Shelton Ernest N and Mary Ruth
Purchase Details
Closed on
May 17, 1957
Bought by
Hale Bernice
Create a Home Valuation Report for This Property
The Home Valuation Report is an in-depth analysis detailing your home's value as well as a comparison with similar homes in the area
Home Values in the Area
Average Home Value in this Area
Purchase History
| Date | Buyer | Sale Price | Title Company |
|---|---|---|---|
| New Destiny Dog Rescue | $125,000 | None Available | |
| Landers Tyler | $110,000 | -- | |
| Kelton Herbert | $185,000 | -- | |
| Hardison Jerry A | $57,500 | -- | |
| Kelton Herbert | -- | -- | |
| Shelton Ernest N | -- | -- | |
| Hale Bernice | -- | -- |
Source: Public Records
Mortgage History
| Date | Status | Borrower | Loan Amount |
|---|---|---|---|
| Open | New Destiny Dog Rescue | $112,500 |
Source: Public Records
Tax History Compared to Growth
Tax History
| Year | Tax Paid | Tax Assessment Tax Assessment Total Assessment is a certain percentage of the fair market value that is determined by local assessors to be the total taxable value of land and additions on the property. | Land | Improvement |
|---|---|---|---|---|
| 2024 | -- | $0 | $0 | $0 |
| 2023 | $1,842 | $0 | $0 | $0 |
| 2022 | $1,842 | $47,040 | $29,400 | $17,640 |
| 2021 | $1,672 | $47,040 | $29,400 | $17,640 |
| 2020 | $1,514 | $47,040 | $29,400 | $17,640 |
| 2019 | $1,514 | $34,160 | $20,160 | $14,000 |
| 2018 | $1,480 | $34,160 | $20,160 | $14,000 |
| 2017 | $1,480 | $34,160 | $20,160 | $14,000 |
| 2016 | $1,465 | $34,160 | $20,160 | $14,000 |
| 2015 | $1,465 | $34,160 | $20,160 | $14,000 |
| 2014 | $1,140 | $29,073 | $0 | $0 |
Source: Public Records
Map
Nearby Homes
- 112 E Cedar St
- 703 Deery St
- 636 Deery St
- 0 Hilltop Rd Unit RTC2897754
- 0 Hilltop Rd Unit RTC3001632
- 724 Alton Ave
- 713 King Ave
- 1017 Fairfield Pike
- 714 King Ave
- 527 Deery St
- 610 Sundance St
- 178 Lucas Rd
- 216 Celebration St
- 115 Scotland Heights
- 102 Saddlewood Dr
- 134 Butler St
- 129 Annas Way
- 464 Whitthorne St
- 304 Lee Ln
- 114 Collier Ave
- 200 E Highland Ave
- 121 E Highland Ave
- 116 E Highland Ave
- 119 E Highland Ave
- 842 N Jefferson St
- 117 E Highland Ave
- 126 E Cedar St
- 124 E Cedar St
- 130 E Cedar St Unit G
- 130 E Cedar St Unit F
- 130 E Cedar St
- 120 E Cedar St
- 112 E Highland Ave
- 114 E Cedar St
- 111 E Highland Ave
- 705 Deery St
- 760 N Main St
- 107 E Highland Ave
- 110 E Cedar St
- 132 E Cedar St