202 E Iris St Oxnard, CA 93033
Cal-Gisler NeighborhoodEstimated Value: $439,000 - $846,000
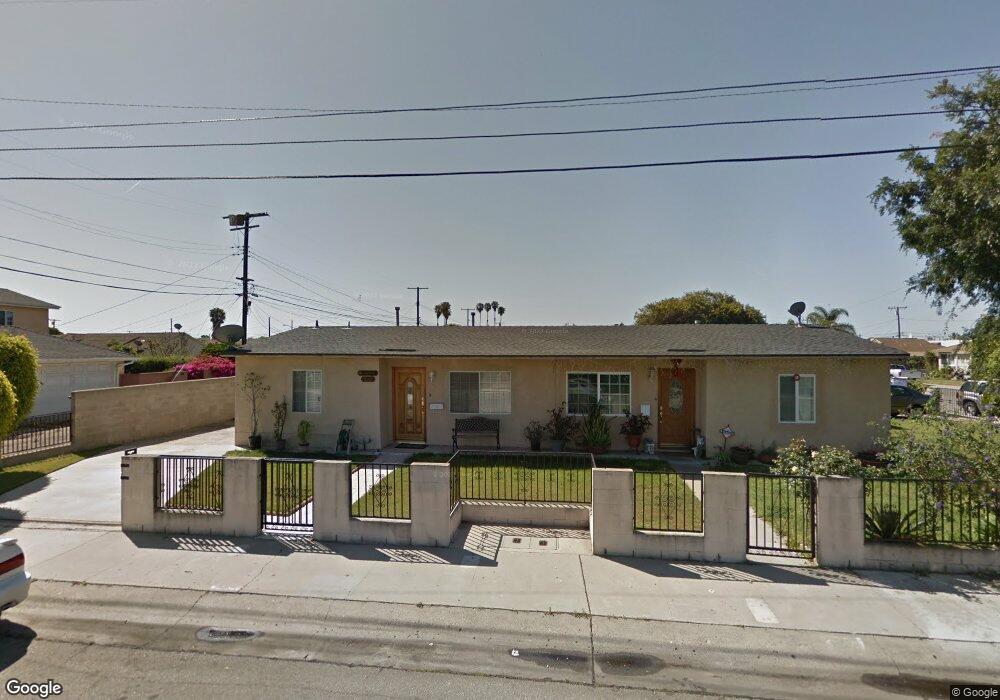
About This Home
This home is located at 202 E Iris St, Oxnard, CA 93033 and is currently estimated at $653,932, approximately $530 per square foot. 202 E Iris St is a home located in Ventura County with nearby schools including Harrington Elementary School, R.J. Frank Academy of Marine Science & Engineering, and Channel Islands High School.
Ownership History
We collect this data history from publicly available records. To have your information removed, we recommend requesting removal directly through your county’s website.
Purchase Details
Purchase Details
Home Financials for this Owner
Home Financials are based on the most recent Mortgage that was taken out on this home.Home Values in the Area
Average Home Value in this Area
Purchase History
We collect this data history from publicly available records. To have your information removed, we recommend requesting removal directly through your county’s website.
| Date | Buyer | Sale Price | Title Company |
|---|---|---|---|
| -- | None Available | ||
| -- | None Available | ||
| -- | Chicago Title Co |
Mortgage History
We collect this data history from publicly available records. To have your information removed, we recommend requesting removal directly through your county’s website.
| Date | Status | Borrower | Loan Amount |
|---|---|---|---|
| Closed | $114,000 |
Tax History
We collect this data history from publicly available records. To have your information removed, we recommend requesting removal directly through your county’s website.
| Year | Tax Paid | Tax Assessment Tax Assessment Total Assessment is a certain percentage of the fair market value that is determined by local assessors to be the total taxable value of land and additions on the property. | Land | Improvement |
|---|---|---|---|---|
| 2025 | $5,009 | $411,222 | $247,171 | $164,051 |
| 2024 | $5,009 | $403,159 | $242,324 | $160,835 |
| 2023 | $4,827 | $395,254 | $237,572 | $157,682 |
| 2022 | $4,683 | $387,504 | $232,913 | $154,591 |
| 2021 | $4,645 | $379,906 | $228,346 | $151,560 |
| 2020 | $4,732 | $376,012 | $226,005 | $150,007 |
| 2019 | $4,599 | $368,640 | $221,574 | $147,066 |
| 2018 | $4,535 | $361,413 | $217,230 | $144,183 |
| 2017 | $4,304 | $354,327 | $212,971 | $141,356 |
| 2016 | $4,154 | $347,381 | $208,796 | $138,585 |
| 2015 | $4,198 | $342,164 | $205,660 | $136,504 |
| 2014 | $4,152 | $335,449 | $201,624 | $133,825 |
Map
- 222 W Juniper St
- 634 E Kamala St
- 456 E Poplar St
- 244 E Birch St
- 168 Lark St
- 721 W Linden Dr
- 2024 S J St
- 450 Hill St
- 1239 S C St
- 1428 S G St
- 1159 S C St
- 970 W Laurel St
- 205 E Driffill Blvd Unit 137
- 3138 S K St
- 1045 Evanston Place
- 300 Ibsen Place Unit 132
- 245 Gaviota Place Unit 146
- 945 S E St
- 3620 San Simeon Ave
- 865 S B St Unit Q2
- 2135 Montrose St
- 2205 Montrose St
- 2111 Montrose St
- 2215 Montrose St
- 2136 San Marino St
- 2107 Montrose St
- 2204 San Marino St
- 2124 San Marino St
- 305 E Juniper St
- 304 E Juniper St
- 2214 San Marino St
- 2114 San Marino St
- 2225 Montrose St
- 212 E Iris St
- 315 E Juniper St
- 314 E Juniper St
- 2224 San Marino St
- 302 E Iris St
- 2233 Montrose St
- 305 E Kamala St
Ask me questions while you tour the home.