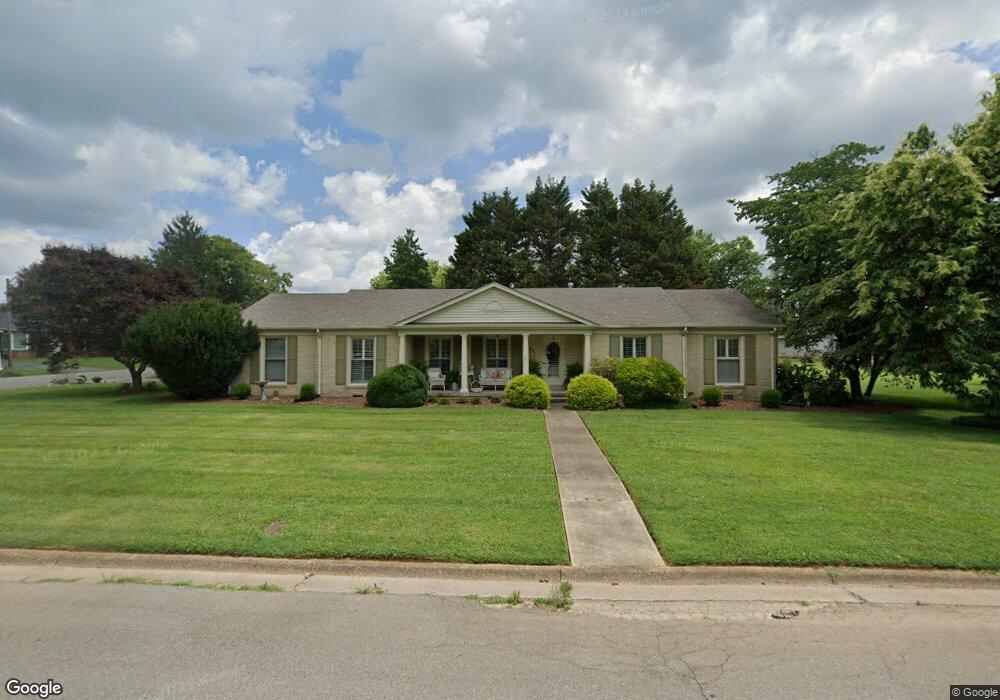
202 Fleet Ave Lawrenceburg, TN 38464
Estimated Value: $242,000 - $264,000
--
Bed
2
Baths
1,686
Sq Ft
$151/Sq Ft
Est. Value
About This Home
This home is located at 202 Fleet Ave, Lawrenceburg, TN 38464 and is currently estimated at $254,488, approximately $150 per square foot. 202 Fleet Ave is a home located in Lawrence County with nearby schools including Ingram Sowell Elementary School, Lawrenceburg Public Elementary School, and David Crockett Elementary School.
Ownership History
Date
Name
Owned For
Owner Type
Purchase Details
Closed on
May 8, 2012
Sold by
Hillhouse Janice Tinin
Bought by
Brewer Barbara
Current Estimated Value
Purchase Details
Closed on
Feb 4, 2008
Sold by
Grover Spivey
Bought by
Janice Tinin
Purchase Details
Closed on
Dec 27, 2004
Sold by
Gary Rohling
Bought by
Grover Spivey
Purchase Details
Closed on
Mar 31, 2004
Sold by
Jpmorgan Chase Bank
Bought by
Gary Rohling
Purchase Details
Closed on
Dec 29, 2003
Sold by
Joseph Prince and Joseph Penny
Bought by
Jp Morgan Chase Bank
Purchase Details
Closed on
Nov 27, 2000
Sold by
Mccain Mary O
Bought by
Joseph Prince
Home Financials for this Owner
Home Financials are based on the most recent Mortgage that was taken out on this home.
Original Mortgage
$72,000
Interest Rate
7.71%
Purchase Details
Closed on
Apr 14, 1986
Bought by
Mccain Mary O and Burgess Donna E
Purchase Details
Closed on
Jan 1, 1980
Create a Home Valuation Report for This Property
The Home Valuation Report is an in-depth analysis detailing your home's value as well as a comparison with similar homes in the area
Home Values in the Area
Average Home Value in this Area
Purchase History
| Date | Buyer | Sale Price | Title Company |
|---|---|---|---|
| Brewer Barbara | $95,000 | -- | |
| Janice Tinin | -- | -- | |
| Grover Spivey | $85,000 | -- | |
| Gary Rohling | $77,900 | -- | |
| Jp Morgan Chase Bank | $85,300 | -- | |
| Joseph Prince | $80,000 | -- | |
| Mccain Mary O | $55,000 | -- | |
| -- | $53,500 | -- |
Source: Public Records
Mortgage History
| Date | Status | Borrower | Loan Amount |
|---|---|---|---|
| Previous Owner | Not Available | $72,000 |
Source: Public Records
Tax History Compared to Growth
Tax History
| Year | Tax Paid | Tax Assessment Tax Assessment Total Assessment is a certain percentage of the fair market value that is determined by local assessors to be the total taxable value of land and additions on the property. | Land | Improvement |
|---|---|---|---|---|
| 2024 | $1,394 | $44,850 | $5,000 | $39,850 |
| 2023 | $1,394 | $44,850 | $5,000 | $39,850 |
| 2022 | $1,394 | $44,850 | $5,000 | $39,850 |
| 2021 | $1,061 | $24,125 | $3,125 | $21,000 |
| 2020 | $1,061 | $24,125 | $3,125 | $21,000 |
| 2019 | $1,061 | $24,125 | $3,125 | $21,000 |
| 2018 | $1,061 | $24,125 | $3,125 | $21,000 |
| 2017 | $1,061 | $24,125 | $3,125 | $21,000 |
| 2016 | $1,061 | $24,125 | $3,125 | $21,000 |
| 2015 | $1,004 | $24,125 | $3,125 | $21,000 |
| 2014 | $920 | $22,100 | $2,500 | $19,600 |
Source: Public Records
Map
Nearby Homes