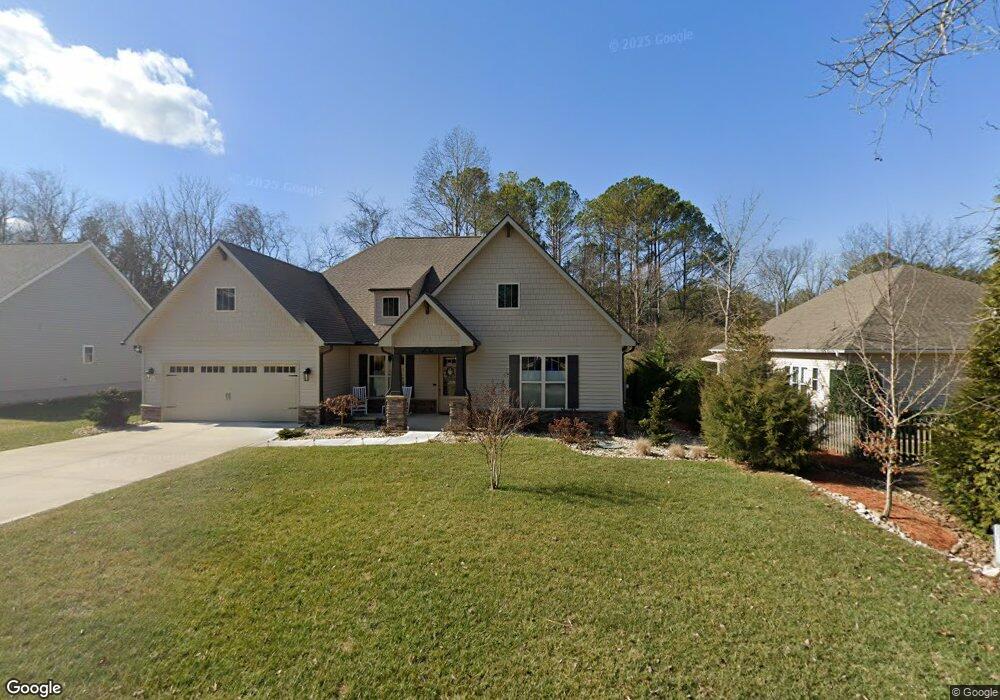
202 Gadusi Way Loudon, TN 37774
Tellico Village NeighborhoodEstimated Value: $644,587 - $774,000
3
Beds
3
Baths
2,421
Sq Ft
$289/Sq Ft
Est. Value
About This Home
This home is located at 202 Gadusi Way, Loudon, TN 37774 and is currently estimated at $699,397, approximately $288 per square foot. 202 Gadusi Way is a home with nearby schools including Loudon High School.
Ownership History
Date
Name
Owned For
Owner Type
Purchase Details
Closed on
Jan 11, 2023
Sold by
Bergren Francis and Bergren Jo Ann
Bought by
Bergren Family Revocable Trust
Current Estimated Value
Purchase Details
Closed on
Nov 5, 2021
Sold by
Cook Bros Construction Llc
Bought by
Bergren Francis and Bergren Jo Ann
Purchase Details
Closed on
Aug 21, 2020
Sold by
Akj Llc
Bought by
Cook Bros Construction Llc
Purchase Details
Closed on
Sep 25, 2017
Sold by
Cs Holdings Llc
Bought by
Bevis Jon R and Bevis Dorothy L
Purchase Details
Closed on
Oct 29, 2015
Sold by
Colladay Thomas R
Bought by
Akj Llc
Purchase Details
Closed on
Oct 12, 2007
Sold by
St-Cyr Anette L
Bought by
Colladay Thomas R
Purchase Details
Closed on
Jan 21, 2006
Sold by
Underwood Glenn R
Bought by
St Cyr Louis Leveque
Purchase Details
Closed on
May 22, 1998
Sold by
Gilley & Sons Inc
Bought by
Glenn Underwood
Purchase Details
Closed on
Jun 3, 1997
Bought by
Gilley & Sons Inc
Purchase Details
Closed on
Feb 21, 1990
Bought by
Ellis Charles E and Ellis Donna Mae
Create a Home Valuation Report for This Property
The Home Valuation Report is an in-depth analysis detailing your home's value as well as a comparison with similar homes in the area
Home Values in the Area
Average Home Value in this Area
Purchase History
| Date | Buyer | Sale Price | Title Company |
|---|---|---|---|
| Bergren Family Revocable Trust | -- | -- | |
| Bergren Family Revocable Trust | -- | None Listed On Document | |
| Bergren Francis | $468,000 | Paramount Land Ttl Of Knoxvi | |
| Cook Bros Construction Llc | $4,000 | Paramount Land Ttl Of Knoxvi | |
| Bevis Jon R | $3,200 | None Available | |
| Akj Llc | $1,500 | -- | |
| Colladay Thomas R | $37,000 | -- | |
| St Cyr Louis Leveque | $18,500 | -- | |
| Glenn Underwood | $3,500 | -- | |
| Gilley & Sons Inc | $14,000 | -- | |
| Ellis Charles E | $14,000 | -- |
Source: Public Records
Tax History Compared to Growth
Tax History
| Year | Tax Paid | Tax Assessment Tax Assessment Total Assessment is a certain percentage of the fair market value that is determined by local assessors to be the total taxable value of land and additions on the property. | Land | Improvement |
|---|---|---|---|---|
| 2025 | $1,751 | $115,350 | $3,750 | $111,600 |
| 2023 | $1,751 | $115,350 | $0 | $0 |
| 2022 | $1,751 | $115,350 | $3,750 | $111,600 |
| 2021 | $57 | $115,350 | $3,750 | $111,600 |
| 2020 | $68 | $3,750 | $3,750 | $0 |
| 2019 | $68 | $3,750 | $3,750 | $0 |
| 2018 | $68 | $3,750 | $3,750 | $0 |
| 2017 | $68 | $3,750 | $3,750 | $0 |
| 2016 | $116 | $6,250 | $6,250 | $0 |
| 2015 | $116 | $6,250 | $6,250 | $0 |
| 2014 | $116 | $6,250 | $6,250 | $0 |
Source: Public Records
Map
Nearby Homes
- 313 Gadusi Ln
- 297 Dudala Way
- 310 Dudala Way
- 238 Gadusi Way
- 268 Dudala Way
- 218 Mialaquo Cir
- 500 Dudala Cir
- 108 Oostagala Dr
- 102 Oostagala Dr
- 208 Mialaquo Cir
- 348 Dudala Way
- 506 Dudala Ln
- 121 Inagehi Way
- 308 Oostagala Ln
- 317 Inagehi Ln
- 117 Inagehi Way
- 149 Gado Way
- 123 Gado Way
- 138 Gado Way
- 114 Inagehi Way
- Lot 2 Dudala Way
- 141 Dudala Way
- 204 Gadusi Way
- 131 Dudala Way
- 203 Gadusi Way
- 205 Gadusi Way
- 145 Dudala Way
- 129 Dudala Way
- 208 Gadusi Way
- 207 Gadusi Way
- 207 Gadusi Way
- 171 Dudala Way
- 183 Dudala Way
- 140 Dudala Way
- Lot 10 Dudala Way
- 142 Dudala Way
- 128 Dudala Way
- 303 Gadusi Ln
- 0 Dudala Way Unit 284796
- 0 Dudala Way Unit 594508