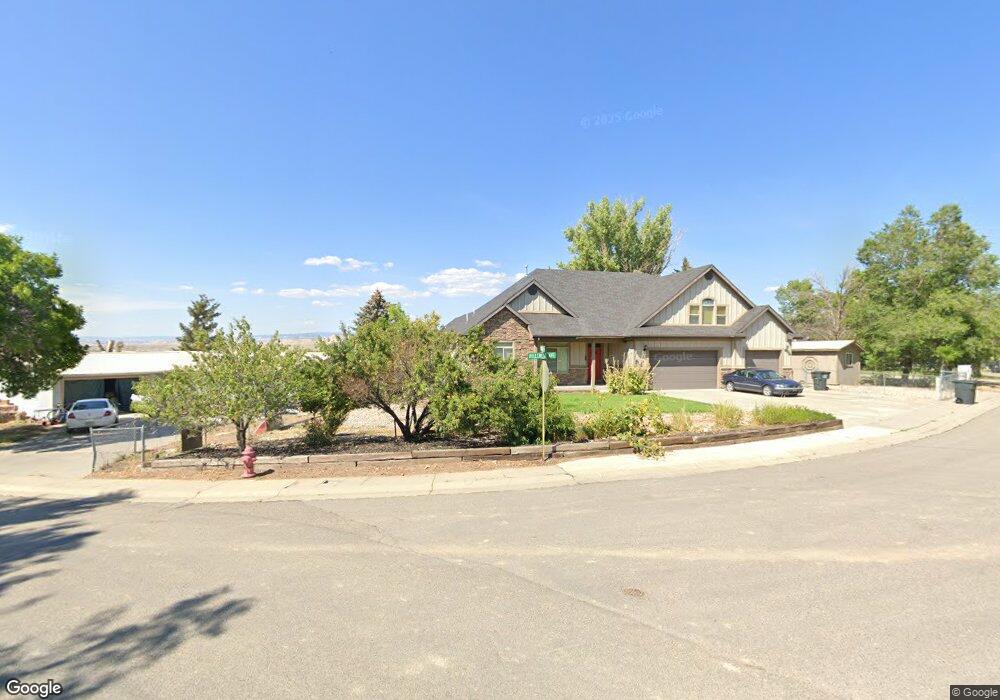
202 Hillcrest Ave Rangely, CO 81648
Estimated Value: $283,760 - $319,000
3
Beds
3
Baths
2,786
Sq Ft
$106/Sq Ft
Est. Value
About This Home
This home is located at 202 Hillcrest Ave, Rangely, CO 81648 and is currently estimated at $296,440, approximately $106 per square foot. 202 Hillcrest Ave is a home located in Rio Blanco County with nearby schools including Parkview Elementary School, Rangely Junior/Senior High School, and Rangely Christian Academy.
Create a Home Valuation Report for This Property
The Home Valuation Report is an in-depth analysis detailing your home's value as well as a comparison with similar homes in the area
Home Values in the Area
Average Home Value in this Area
Tax History
| Year | Tax Paid | Tax Assessment Tax Assessment Total Assessment is a certain percentage of the fair market value that is determined by local assessors to be the total taxable value of land and additions on the property. | Land | Improvement |
|---|---|---|---|---|
| 2024 | $912 | $13,230 | $890 | $12,340 |
| 2023 | $556 | $13,230 | $890 | $12,340 |
| 2022 | $563 | $14,660 | $1,140 | $13,520 |
| 2021 | $565 | $14,660 | $1,140 | $13,520 |
| 2020 | $577 | $15,230 | $1,170 | $14,060 |
| 2019 | $1,021 | $15,230 | $1,170 | $14,060 |
| 2018 | $1,002 | $16,010 | $1,180 | $14,830 |
| 2017 | $1,117 | $16,010 | $1,180 | $14,830 |
| 2016 | $1,221 | $18,220 | $1,310 | $16,910 |
| 2015 | -- | $18,220 | $0 | $0 |
| 2014 | -- | $16,950 | $0 | $0 |
| 2013 | $955 | $16,950 | $0 | $0 |
| 2012 | $955 | $17,240 | $1,270 | $15,970 |
Source: Public Records
Map
Nearby Homes
- 515 Lake St
- 243 Crest St
- 251 E Raven Ave
- 206 E Rangely Ave
- 1215 La Mesa Cir
- 1235 La Mesa Cir
- 1225 La Mesa Cir
- 1210 La Mesa Cir
- 215 Prospect St
- 805 Pinyon Ct
- 302 W Main St
- 234 S Stanolind Ave
- 1542 La Mesa Cir
- 1351 La Mesa Cir
- 1250 Deserado Dr
- 203 Dakota Ave
- 903 Taos Dr
- 1041 Halfturn Rd
- 1100 Tanglewood Ln
- 0 County Road 101
- 204 Hillcrest Ave
- 207 Hillcrest Cir
- 211 Hillcrest Cir
- 201 Hillcrest Cir
- 219 Hillcrest Ave
- 201 Hillcrest Ave
- 0 Hillcrest Cir
- 205 Hillcrest Ave
- 215 Hillcrest Cir
- 210 Hillcrest Ave
- 306 Hillcrest Ave
- 209 Hillcrest Ave
- 214 Hillcrest Cir
- 215 Hillcrest Ave
- 216 Hillcrest Ave
- 220 Ridge Rd
- 221 Hillcrest Cir
- 216 Ridge Rd
- 221 Ridge Rd
- 219 Ridge Rd
Your Personal Tour Guide
Ask me questions while you tour the home.