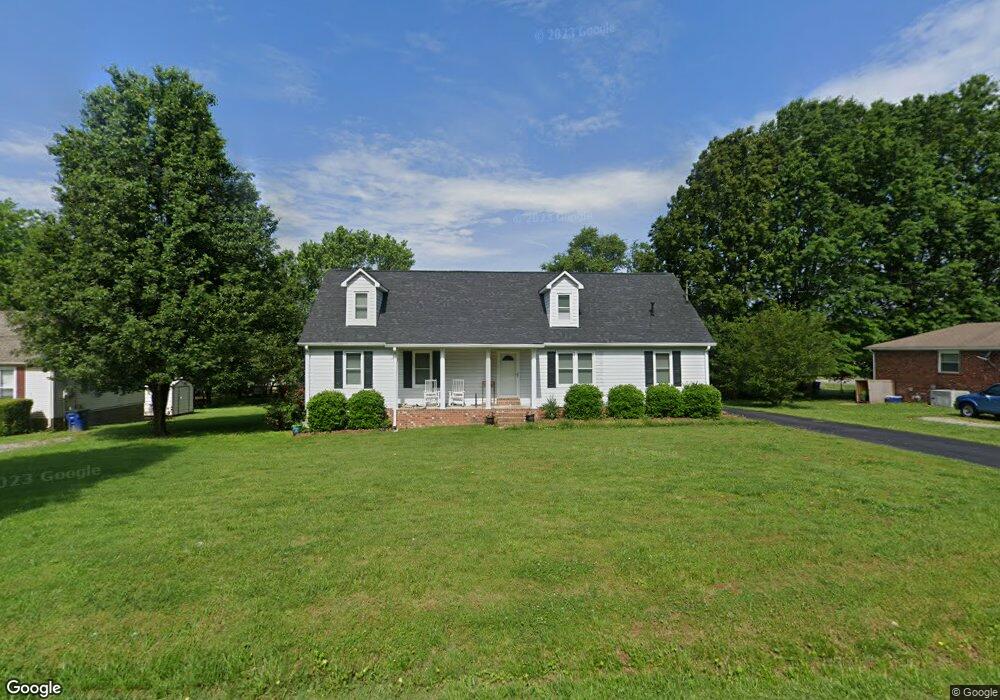
202 Keenan Ln Shelbyville, TN 37160
Estimated Value: $313,321 - $406,000
--
Bed
2
Baths
2,643
Sq Ft
$134/Sq Ft
Est. Value
About This Home
This home is located at 202 Keenan Ln, Shelbyville, TN 37160 and is currently estimated at $353,330, approximately $133 per square foot. 202 Keenan Ln is a home located in Bedford County with nearby schools including South Side Elementary School, Harris Middle School, and Christian Chapel Academy.
Ownership History
Date
Name
Owned For
Owner Type
Purchase Details
Closed on
Dec 19, 2018
Sold by
Whitworth Rhonda Jean and Whitworth Jeans
Bought by
Whitworth Rhonda Jean and Whitworth Jeans
Current Estimated Value
Purchase Details
Closed on
Nov 26, 2001
Sold by
West William and West Rhonda
Bought by
Jeans Michael R Rhonda
Purchase Details
Closed on
Mar 28, 1990
Bought by
West William B
Purchase Details
Closed on
Aug 15, 1989
Bought by
Sec Of Veterans Affairs
Purchase Details
Closed on
Oct 7, 1987
Bought by
Stewart George A
Create a Home Valuation Report for This Property
The Home Valuation Report is an in-depth analysis detailing your home's value as well as a comparison with similar homes in the area
Home Values in the Area
Average Home Value in this Area
Purchase History
| Date | Buyer | Sale Price | Title Company |
|---|---|---|---|
| Whitworth Rhonda Jean | -- | None Available | |
| Jeans Michael R Rhonda | -- | -- | |
| West William B | $61,300 | -- | |
| Sec Of Veterans Affairs | $66,000 | -- | |
| Stewart George A | $74,000 | -- |
Source: Public Records
Tax History Compared to Growth
Tax History
| Year | Tax Paid | Tax Assessment Tax Assessment Total Assessment is a certain percentage of the fair market value that is determined by local assessors to be the total taxable value of land and additions on the property. | Land | Improvement |
|---|---|---|---|---|
| 2025 | -- | $54,400 | $0 | $0 |
| 2024 | -- | $54,400 | $8,250 | $46,150 |
| 2023 | $2,070 | $54,400 | $8,250 | $46,150 |
| 2022 | $2,130 | $54,400 | $8,250 | $46,150 |
| 2021 | $1,934 | $54,400 | $8,250 | $46,150 |
| 2020 | $1,654 | $54,400 | $8,250 | $46,150 |
| 2019 | $1,654 | $37,325 | $5,250 | $32,075 |
| 2018 | $1,617 | $37,325 | $5,250 | $32,075 |
| 2017 | $1,617 | $37,325 | $5,250 | $32,075 |
| 2016 | $1,602 | $37,325 | $5,250 | $32,075 |
| 2015 | $1,601 | $37,325 | $5,250 | $32,075 |
| 2014 | $1,170 | $29,840 | $0 | $0 |
Source: Public Records
Map
Nearby Homes