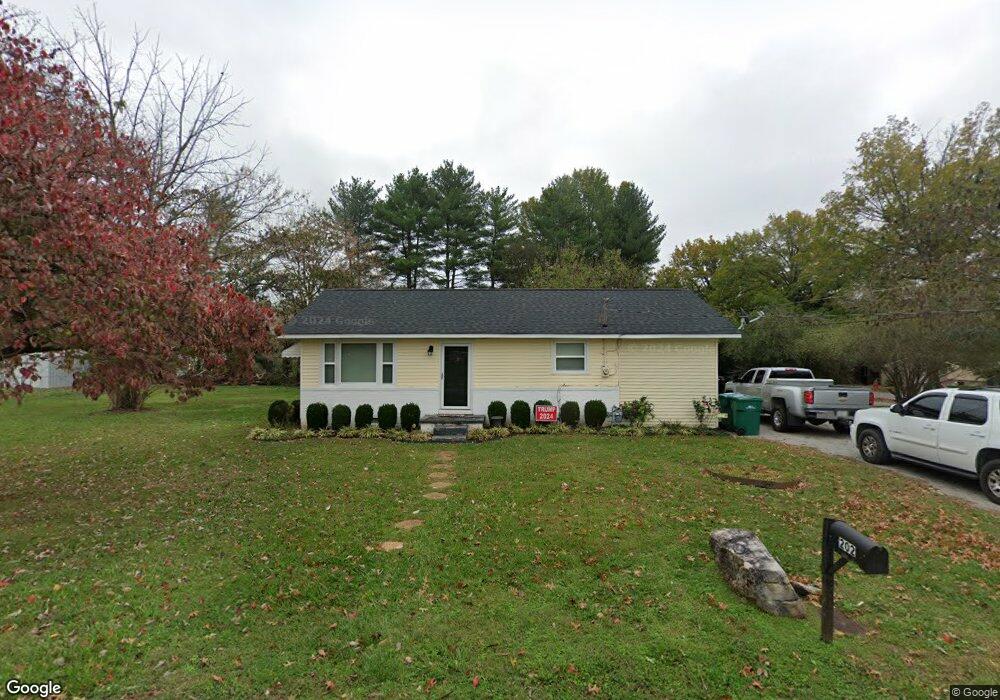
202 Lillian St Winchester, TN 37398
Estimated Value: $137,878 - $198,000
Studio
1
Bath
1,008
Sq Ft
$171/Sq Ft
Est. Value
About This Home
This home is located at 202 Lillian St, Winchester, TN 37398 and is currently estimated at $172,626, approximately $171 per square foot. 202 Lillian St is a home located in Franklin County with nearby schools including North Middle School, Franklin County High School, and Winchester Christian Academy.
Ownership History
Date
Name
Owned For
Owner Type
Purchase Details
Closed on
Jul 12, 2001
Sold by
Lowe James and Hawk Marie
Bought by
Hutson Larry D and Hutson Sylvia L
Current Estimated Value
Home Financials for this Owner
Home Financials are based on the most recent Mortgage that was taken out on this home.
Original Mortgage
$33,000
Outstanding Balance
$12,368
Interest Rate
7.08%
Estimated Equity
$160,258
Purchase Details
Closed on
Sep 1, 2000
Sold by
Hill Terry
Bought by
Lowe Marie Hawk
Purchase Details
Closed on
Dec 21, 1999
Sold by
Lowe Marie H
Bought by
Hill Terry
Purchase Details
Closed on
Apr 28, 1998
Sold by
Endy Annette
Bought by
Lowe Marie H
Purchase Details
Closed on
Nov 1, 1990
Bought by
Endy Annette
Purchase Details
Closed on
Jul 26, 1986
Bought by
Goins Frank and Goins Annette Endy
Purchase Details
Closed on
Mar 4, 1982
Purchase Details
Closed on
Jul 30, 1951
Create a Home Valuation Report for This Property
The Home Valuation Report is an in-depth analysis detailing your home's value as well as a comparison with similar homes in the area
Home Values in the Area
Average Home Value in this Area
Purchase History
| Date | Buyer | Sale Price | Title Company |
|---|---|---|---|
| Hutson Larry D | $35,000 | -- | |
| Lowe Marie Hawk | $40,000 | -- | |
| Hill Terry | $45,000 | -- | |
| Lowe Marie H | $40,000 | -- | |
| Endy Annette | -- | -- | |
| Goins Frank | -- | -- | |
| -- | -- | -- | |
| -- | -- | -- |
Source: Public Records
Mortgage History
| Date | Status | Borrower | Loan Amount |
|---|---|---|---|
| Open | Not Available | $33,000 |
Source: Public Records
Tax History
| Year | Tax Paid | Tax Assessment Tax Assessment Total Assessment is a certain percentage of the fair market value that is determined by local assessors to be the total taxable value of land and additions on the property. | Land | Improvement |
|---|---|---|---|---|
| 2025 | -- | $23,800 | $5,650 | $18,150 |
| 2024 | -- | $23,800 | $5,650 | $18,150 |
| 2023 | $612 | $23,800 | $5,650 | $18,150 |
| 2022 | $600 | $23,800 | $5,650 | $18,150 |
| 2021 | $292 | $23,800 | $5,650 | $18,150 |
| 2020 | $403 | $11,400 | $3,500 | $7,900 |
| 2019 | $403 | $11,400 | $3,500 | $7,900 |
| 2018 | $380 | $11,400 | $3,500 | $7,900 |
| 2017 | $380 | $11,400 | $3,500 | $7,900 |
| 2016 | $350 | $10,525 | $3,500 | $7,025 |
| 2015 | $344 | $10,525 | $3,500 | $7,025 |
| 2014 | $332 | $10,155 | $0 | $0 |
Source: Public Records
Map
Nearby Homes
- 0 Sharp Springs Rd Unit RTC3134214
- 540 Milton Ln
- 713 Hunt St
- 417 Laura Ave
- 103 Lisa Cir
- 711 Hunt St
- 119 Highland Dr
- 107 Highland Dr
- 211 S Porter St
- 213 S Porter St
- 215 S Porter St
- 217 S Porter St
- 1019 Old Cowan Rd
- 102 Dogwood Ln
- 203 3rd Ave NE
- 1110 Hunt St
- 201&203 3rd Ave NE
- 0 River Watch Way Unit RTC3119354
- 0 River Watch Way Unit 364
- 0 River Watch Way Unit 266
Your Personal Tour Guide
Ask me questions while you tour the home.