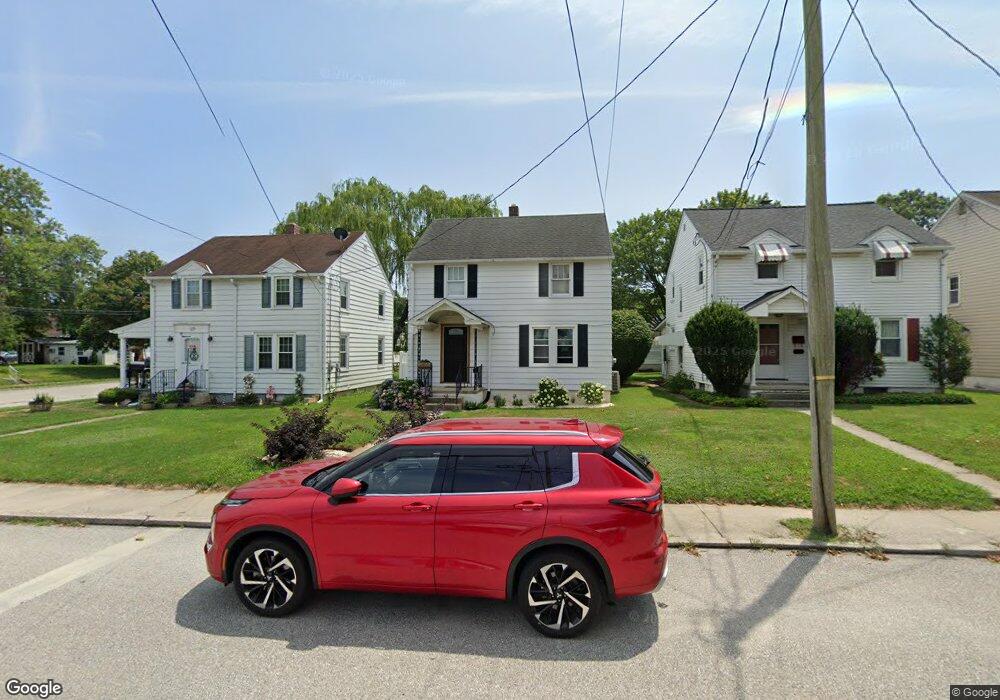
202 Maple Ave Hanover, PA 17331
Hanover Historic District NeighborhoodEstimated Value: $200,000 - $235,000
3
Beds
2
Baths
1,152
Sq Ft
$187/Sq Ft
Est. Value
About This Home
This home is located at 202 Maple Ave, Hanover, PA 17331 and is currently estimated at $215,601, approximately $187 per square foot. 202 Maple Ave is a home located in York County with nearby schools including Clearview Elementary School, Washington Elementary School, and Hanover Middle School.
Ownership History
Date
Name
Owned For
Owner Type
Purchase Details
Closed on
Jun 21, 2021
Sold by
Hall James and Hall Marsha
Bought by
Jacoby Robert W and Jacoby Shilo Ann
Current Estimated Value
Home Financials for this Owner
Home Financials are based on the most recent Mortgage that was taken out on this home.
Original Mortgage
$149,246
Outstanding Balance
$134,534
Interest Rate
2.9%
Mortgage Type
FHA
Estimated Equity
$81,067
Purchase Details
Closed on
Mar 21, 2003
Sold by
Stahl Thomas M and Stahl Linda A
Bought by
Hall James and Hall Marsha
Home Financials for this Owner
Home Financials are based on the most recent Mortgage that was taken out on this home.
Original Mortgage
$76,720
Interest Rate
4.75%
Mortgage Type
Purchase Money Mortgage
Create a Home Valuation Report for This Property
The Home Valuation Report is an in-depth analysis detailing your home's value as well as a comparison with similar homes in the area
Home Values in the Area
Average Home Value in this Area
Purchase History
| Date | Buyer | Sale Price | Title Company |
|---|---|---|---|
| Jacoby Robert W | $152,000 | Homesale Settlements Svcs | |
| Hall James | $95,900 | -- |
Source: Public Records
Mortgage History
| Date | Status | Borrower | Loan Amount |
|---|---|---|---|
| Open | Jacoby Robert W | $149,246 | |
| Previous Owner | Hall James | $76,720 |
Source: Public Records
Tax History
| Year | Tax Paid | Tax Assessment Tax Assessment Total Assessment is a certain percentage of the fair market value that is determined by local assessors to be the total taxable value of land and additions on the property. | Land | Improvement |
|---|---|---|---|---|
| 2025 | $3,652 | $99,760 | $22,800 | $76,960 |
| 2024 | $3,624 | $99,760 | $22,800 | $76,960 |
| 2023 | $3,596 | $99,760 | $22,800 | $76,960 |
| 2022 | $3,552 | $99,760 | $22,800 | $76,960 |
| 2021 | $3,453 | $99,760 | $22,800 | $76,960 |
| 2020 | $3,453 | $99,760 | $22,800 | $76,960 |
| 2019 | $3,399 | $99,760 | $22,800 | $76,960 |
| 2018 | $3,336 | $99,760 | $22,800 | $76,960 |
| 2017 | $3,273 | $99,760 | $22,800 | $76,960 |
| 2016 | $0 | $99,760 | $22,800 | $76,960 |
| 2015 | -- | $99,760 | $22,800 | $76,960 |
| 2014 | -- | $99,760 | $22,800 | $76,960 |
Source: Public Records
Map
Nearby Homes
Your Personal Tour Guide
Ask me questions while you tour the home.