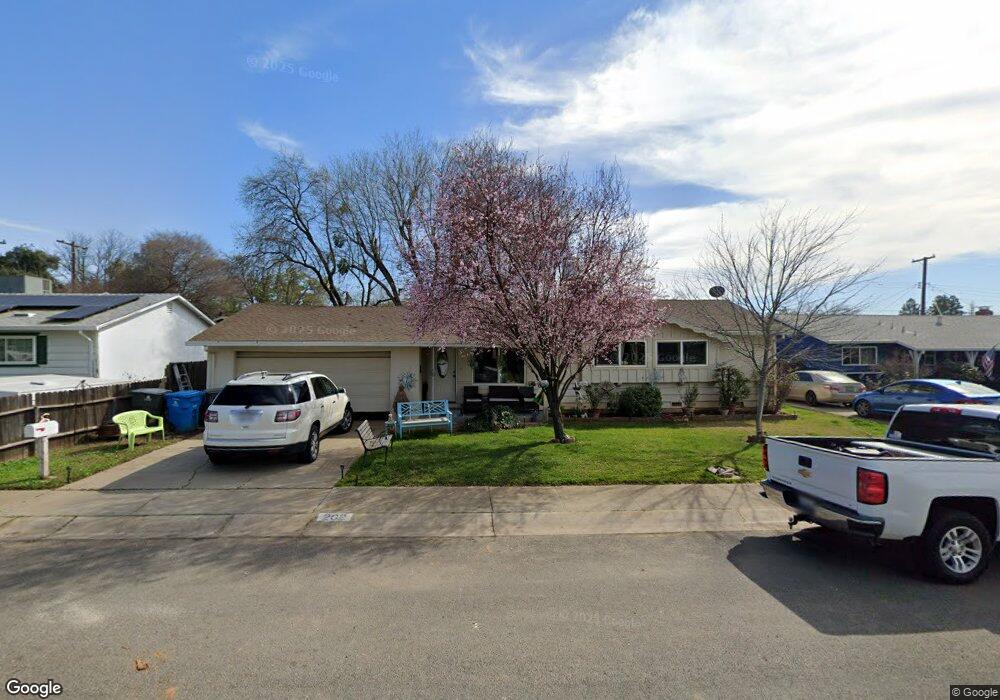
202 Meadow Way Wheatland, CA 95692
Estimated Value: $318,000 - $364,000
3
Beds
2
Baths
1,000
Sq Ft
$344/Sq Ft
Est. Value
About This Home
This home is located at 202 Meadow Way, Wheatland, CA 95692 and is currently estimated at $343,959, approximately $343 per square foot. 202 Meadow Way is a home located in Yuba County with nearby schools including Wheatland Elementary School, Bear River, and Wheatland Union High School.
Ownership History
Date
Name
Owned For
Owner Type
Purchase Details
Closed on
Nov 8, 2021
Sold by
Sylvia Odonnell
Bought by
Odonnell Sylvia and Mathis Randall
Current Estimated Value
Home Financials for this Owner
Home Financials are based on the most recent Mortgage that was taken out on this home.
Original Mortgage
$84,000
Interest Rate
2.33%
Mortgage Type
New Conventional
Purchase Details
Closed on
Apr 29, 2010
Sold by
Mehalakis Steve
Bought by
Odonnell Sylvia
Home Financials for this Owner
Home Financials are based on the most recent Mortgage that was taken out on this home.
Original Mortgage
$80,000
Interest Rate
4.94%
Mortgage Type
Seller Take Back
Purchase Details
Closed on
Apr 12, 2010
Sold by
Greathouse Carolyn Sue
Bought by
Mehalakis Steve and Mehalakis Maria
Home Financials for this Owner
Home Financials are based on the most recent Mortgage that was taken out on this home.
Original Mortgage
$80,000
Interest Rate
4.94%
Mortgage Type
Seller Take Back
Create a Home Valuation Report for This Property
The Home Valuation Report is an in-depth analysis detailing your home's value as well as a comparison with similar homes in the area
Home Values in the Area
Average Home Value in this Area
Purchase History
| Date | Buyer | Sale Price | Title Company |
|---|---|---|---|
| Odonnell Sylvia | $112,500 | Placer Title | |
| Odonnell Sylvia | $94,000 | Placer Title Company | |
| Mehalakis Steve | $60,000 | Placer Title Company |
Source: Public Records
Mortgage History
| Date | Status | Borrower | Loan Amount |
|---|---|---|---|
| Previous Owner | Odonnell Sylvia | $84,000 | |
| Previous Owner | Odonnell Sylvia | $80,000 |
Source: Public Records
Tax History Compared to Growth
Tax History
| Year | Tax Paid | Tax Assessment Tax Assessment Total Assessment is a certain percentage of the fair market value that is determined by local assessors to be the total taxable value of land and additions on the property. | Land | Improvement |
|---|---|---|---|---|
| 2025 | $1,397 | $121,322 | $25,809 | $95,513 |
| 2023 | $1,397 | $116,612 | $24,807 | $91,805 |
| 2022 | $1,350 | $114,326 | $24,321 | $90,005 |
| 2021 | $1,269 | $112,086 | $23,845 | $88,241 |
| 2020 | $1,249 | $110,938 | $23,601 | $87,337 |
| 2019 | $1,227 | $108,764 | $23,139 | $85,625 |
| 2018 | $1,206 | $106,633 | $22,686 | $83,947 |
| 2017 | $1,168 | $104,543 | $22,242 | $82,301 |
| 2016 | $1,154 | $102,494 | $21,806 | $80,688 |
| 2015 | $1,135 | $100,955 | $21,479 | $79,476 |
| 2014 | $1,113 | $98,979 | $21,059 | $77,920 |
Source: Public Records
Map
Nearby Homes
- 213 Main St
- 308 Meadow Way
- 140 Johnson St
- 312 Olive St
- 403 Mesa St
- 111 Mccurry St
- 514 4th St
- 2021 California 65
- 176 Anderson Way
- 613 Nightingale Way
- 280 G St
- 507 Bowers Way
- 826 Griffith Way
- 811 Keyser Dr
- 1152 Cedar Dr
- 1140 Cedar Dr
- 1743 Oakley Ln
- 1906 Oakley Ln
- 2434 Spenceville Rd
- 2636 Spenceville Rd