Estimated Value: $237,941 - $278,000
3
Beds
2
Baths
1,600
Sq Ft
$163/Sq Ft
Est. Value
About This Home
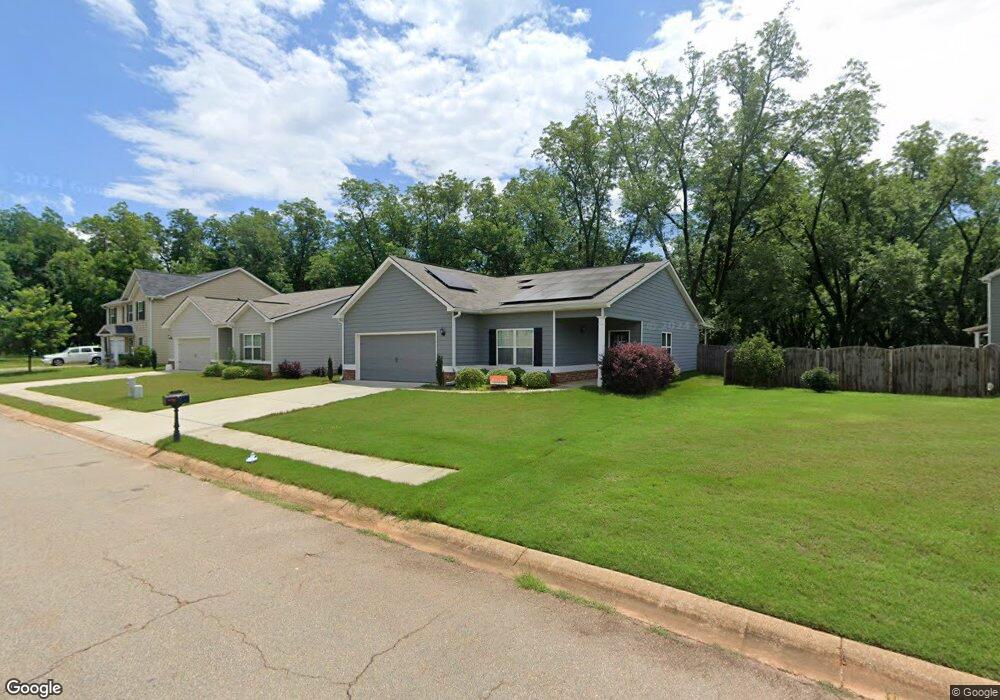
This home is located at 202 North Haven, Byron, GA 31008 and is currently estimated at $260,985, approximately $163 per square foot. 202 North Haven is a home located in Peach County with nearby schools including Byron Elementary School, Byron Middle School, and Peach County High School.
Ownership History
Date
Name
Owned For
Owner Type
Purchase Details
Closed on
Jun 27, 2018
Sold by
Chisel Mill
Bought by
Johnson Andrew
Current Estimated Value
Purchase Details
Closed on
Dec 14, 2017
Sold by
Buckless Lance
Bought by
Chisel Mill
Home Financials for this Owner
Home Financials are based on the most recent Mortgage that was taken out on this home.
Original Mortgage
$109,375
Interest Rate
3.95%
Mortgage Type
Purchase Money Mortgage
Purchase Details
Closed on
Dec 2, 2016
Bought by
Buckless Lance
Purchase Details
Closed on
Mar 26, 2015
Sold by
Redus One Llc
Bought by
Byron Poppy Llc
Purchase Details
Closed on
Jun 4, 2013
Sold by
Knight Development Inc
Bought by
Redus One Llc
Purchase Details
Closed on
Apr 5, 2011
Sold by
The Knight Group Inc
Bought by
Knight Development Inc
Purchase Details
Closed on
Apr 15, 2010
Sold by
Nhi Llc
Bought by
The Knight Group Inc
Create a Home Valuation Report for This Property
The Home Valuation Report is an in-depth analysis detailing your home's value as well as a comparison with similar homes in the area
Home Values in the Area
Average Home Value in this Area
Purchase History
| Date | Buyer | Sale Price | Title Company |
|---|---|---|---|
| Johnson Andrew | $155,900 | -- | |
| Chisel Mill | $14,500 | -- | |
| Buckless Lance | $10,000 | -- | |
| Byron Poppy Llc | $175,000 | -- | |
| Redus One Llc | -- | -- | |
| Knight Development Inc | -- | -- | |
| The Knight Group Inc | -- | -- |
Source: Public Records
Mortgage History
| Date | Status | Borrower | Loan Amount |
|---|---|---|---|
| Previous Owner | Chisel Mill | $109,375 |
Source: Public Records
Tax History
| Year | Tax Paid | Tax Assessment Tax Assessment Total Assessment is a certain percentage of the fair market value that is determined by local assessors to be the total taxable value of land and additions on the property. | Land | Improvement |
|---|---|---|---|---|
| 2025 | $2,956 | $95,960 | $7,600 | $88,360 |
| 2024 | $3,078 | $86,240 | $7,480 | $78,760 |
| 2023 | $3,052 | $84,960 | $6,000 | $78,960 |
| 2022 | $2,025 | $75,240 | $6,000 | $69,240 |
| 2021 | $1,968 | $63,040 | $6,000 | $57,040 |
| 2020 | $1,752 | $56,120 | $6,000 | $50,120 |
| 2019 | $1,761 | $56,120 | $6,000 | $50,120 |
| 2018 | $183 | $6,000 | $6,000 | $0 |
| 2017 | $63 | $6,000 | $6,000 | $0 |
| 2016 | $158 | $6,000 | $6,000 | $0 |
| 2015 | $161 | $4,800 | $4,800 | $0 |
| 2014 | $133 | $4,200 | $4,200 | $0 |
| 2013 | -- | $4,200 | $4,200 | $0 |
Source: Public Records
Map
Nearby Homes
- 101 Poppy Ln
- 711 Main St
- 101 Fawn Ct
- 103 Fawn Ct
- 00 Rum Rd
- 0 Rum Rd Unit 10673128
- 110 Pine Crest Dr
- 107 Pine Hill Cir
- 506 Howard St
- 102 Silver Maple Ct
- 107 Silver Maple Ct
- 204 Sugar Maple Ct
- 416 Moseley Rd
- 109 Silver Maple Ct
- 0 Moseley Rd Unit 261304
- 0 Moseley Rd Unit 183348
- 0 Moseley Rd Unit 10700962
- 0 Highway 42 Unit 10576098
- 319 Greenbriar Dr
- 104 Howard St
- 204 North Haven
- 204 North Haven Unit /260
- 204 N Haven Unit 260
- 206 N Haven Unit 261
- 202 N Haven
- 0 North Haven Unit 259 7423749
- 0 North Haven Unit 260 7423750
- 0 North Haven Unit 260 8021665
- 0 North Haven Unit 259 8021664
- N North Haven
- 203 N Haven Unit 156
- 203 N Haven Unit 156
- 203 N Haven
- 128 Poppy Ln
- 205 N Haven
- 200 Poppy Ln Unit /157
- 200 Poppy Ln
- 126 Poppy Ln Unit 256
- 126 Poppy Ln
- 202 Poppy Ln Unit /158
Your Personal Tour Guide
Ask me questions while you tour the home.