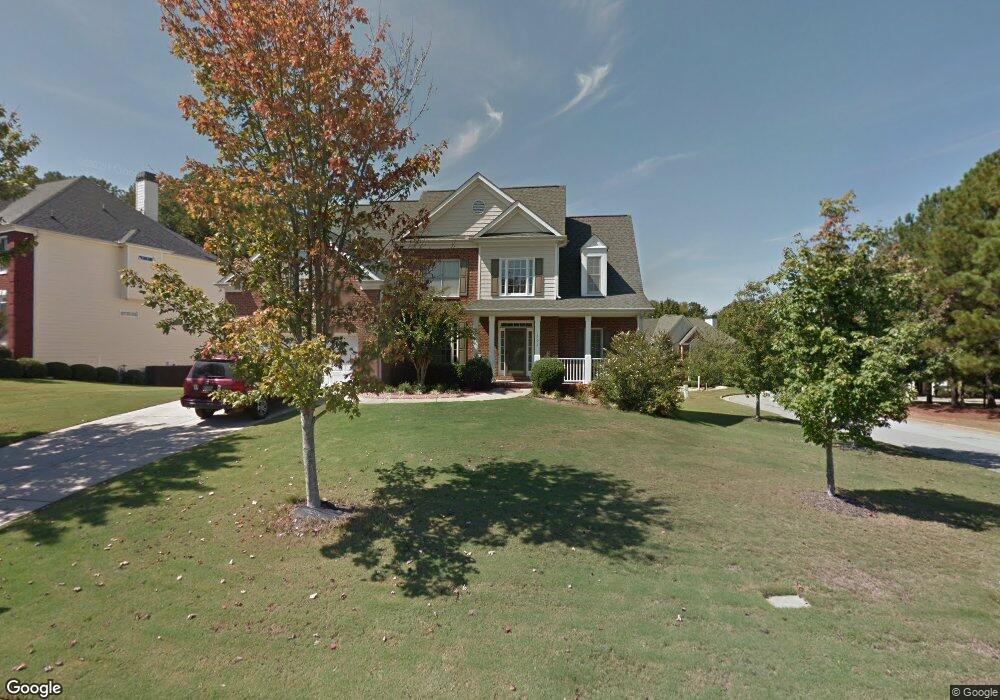
202 Olmstead Trace Newnan, GA 30263
Avery Park NeighborhoodEstimated Value: $472,000 - $583,000
6
Beds
4
Baths
3,776
Sq Ft
$139/Sq Ft
Est. Value
About This Home
This home is located at 202 Olmstead Trace, Newnan, GA 30263 and is currently estimated at $525,077, approximately $139 per square foot. 202 Olmstead Trace is a home located in Coweta County with nearby schools including Elm Street Elementary School, Evans Middle School, and Newnan High School.
Ownership History
Date
Name
Owned For
Owner Type
Purchase Details
Closed on
Jul 19, 2016
Sold by
Faircloth Troy D
Bought by
Hernandez Rafaela and Peguero Raul
Current Estimated Value
Home Financials for this Owner
Home Financials are based on the most recent Mortgage that was taken out on this home.
Original Mortgage
$216,000
Outstanding Balance
$171,856
Interest Rate
3.56%
Estimated Equity
$353,221
Purchase Details
Closed on
Jun 21, 2002
Sold by
Lee Albert I
Bought by
Lee Albert I and Lee Debra
Home Financials for this Owner
Home Financials are based on the most recent Mortgage that was taken out on this home.
Original Mortgage
$207,120
Interest Rate
6.86%
Purchase Details
Closed on
Dec 29, 1999
Sold by
Peachtree City Holdi
Bought by
Kenny Johnson Homes
Purchase Details
Closed on
Aug 24, 1998
Bought by
Peachtree City Holdi
Create a Home Valuation Report for This Property
The Home Valuation Report is an in-depth analysis detailing your home's value as well as a comparison with similar homes in the area
Home Values in the Area
Average Home Value in this Area
Purchase History
| Date | Buyer | Sale Price | Title Company |
|---|---|---|---|
| Hernandez Rafaela | $270,000 | -- | |
| Lee Albert I | -- | -- | |
| Le Albert I | $258,900 | -- | |
| Kenny Johnson Homes | $716,100 | -- | |
| Peachtree City Holdi | $2,810,000 | -- |
Source: Public Records
Mortgage History
| Date | Status | Borrower | Loan Amount |
|---|---|---|---|
| Open | Hernandez Rafaela | $216,000 | |
| Previous Owner | Le Albert I | $207,120 |
Source: Public Records
Tax History Compared to Growth
Tax History
| Year | Tax Paid | Tax Assessment Tax Assessment Total Assessment is a certain percentage of the fair market value that is determined by local assessors to be the total taxable value of land and additions on the property. | Land | Improvement |
|---|---|---|---|---|
| 2025 | $5,021 | $209,046 | $28,000 | $181,046 |
| 2024 | $4,604 | $201,488 | $28,000 | $173,488 |
| 2023 | $4,604 | $186,359 | $24,000 | $162,359 |
| 2022 | $4,337 | $178,252 | $24,000 | $154,252 |
| 2021 | $3,869 | $143,942 | $14,000 | $129,942 |
| 2020 | $3,956 | $143,942 | $14,000 | $129,942 |
| 2019 | $3,453 | $114,967 | $14,000 | $100,967 |
| 2018 | $3,474 | $114,967 | $14,000 | $100,967 |
| 2017 | $3,250 | $114,005 | $14,000 | $100,005 |
| 2016 | $2,528 | $87,687 | $14,000 | $73,687 |
| 2015 | $2,434 | $84,412 | $14,000 | $70,412 |
| 2014 | $2,175 | $78,412 | $8,000 | $70,412 |
Source: Public Records
Map
Nearby Homes
- 28 Vaux Way
- 0 Vaux Way Unit 10652616
- 19 Palladio Way
- 149 Westminster Way
- 88 Vaux Way
- 17 Robinson Ln
- 118 Westminster Way
- 351 The Blvd
- 8 Canterbury Dr
- 448 The Blvd
- 1015 Wahoo Hills
- 442 The Blvd
- 156 N Square Ln
- 78 Bedford Park Dr
- 125 N Square Ln
- 289 Baldwin Ct
- 24 Overbrook Ct
- 137 Alessie Dr
- 367 Old Atlanta Hwy Unit LOT 4
- 371 Old Atlanta Hwy Unit LOT 5
- 208 Olmstead Trace
- 89 Olmstead Park Ln
- 10 Olmstead Park Ln
- 0 Olmstead Park Ln Unit LOT 59 3273148
- 218 Olmstead Trace
- 203 Olmstead Trace
- 199 Olmstead Trace
- 14 Olmstead Park Ln
- 209 Olmstead Trace
- 180 Olmstead Trace
- 193 Olmstead Trace
- 211 Olmstead Trace Unit 72
- 211 Olmstead Trace
- 13 Olmstead Park Ln
- 183 Olmstead Trace
- 219 Olmstead Trace
- 9 Olmstead Park Ln
- 176 Olmstead Trace
- 3 Vaux Park Ln Unit 8
- 223 Olmstead Trace