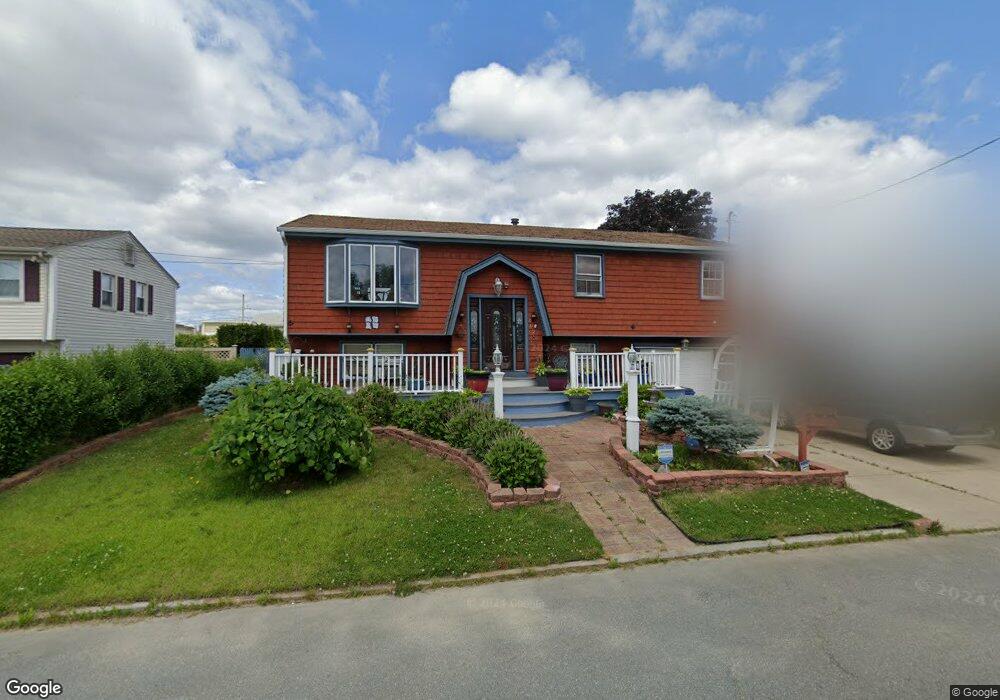
202 Oman St Fall River, MA 02721
Niagara NeighborhoodEstimated Value: $422,000 - $468,000
3
Beds
2
Baths
1,495
Sq Ft
$292/Sq Ft
Est. Value
About This Home
This home is located at 202 Oman St, Fall River, MA 02721 and is currently estimated at $436,982, approximately $292 per square foot. 202 Oman St is a home located in Bristol County with nearby schools including William S Greene, Talbot Innovation School, and B M C Durfee High School.
Ownership History
Date
Name
Owned For
Owner Type
Purchase Details
Closed on
Jun 6, 2003
Sold by
Costa Leon R
Bought by
Cunha Ezequiel N and Cunha Maria E
Current Estimated Value
Home Financials for this Owner
Home Financials are based on the most recent Mortgage that was taken out on this home.
Original Mortgage
$109,000
Outstanding Balance
$47,920
Interest Rate
5.83%
Mortgage Type
Purchase Money Mortgage
Estimated Equity
$389,062
Create a Home Valuation Report for This Property
The Home Valuation Report is an in-depth analysis detailing your home's value as well as a comparison with similar homes in the area
Home Values in the Area
Average Home Value in this Area
Purchase History
| Date | Buyer | Sale Price | Title Company |
|---|---|---|---|
| Cunha Ezequiel N | $209,000 | -- |
Source: Public Records
Mortgage History
| Date | Status | Borrower | Loan Amount |
|---|---|---|---|
| Open | Cunha Ezequiel N | $109,000 |
Source: Public Records
Tax History
| Year | Tax Paid | Tax Assessment Tax Assessment Total Assessment is a certain percentage of the fair market value that is determined by local assessors to be the total taxable value of land and additions on the property. | Land | Improvement |
|---|---|---|---|---|
| 2025 | $4,127 | $360,400 | $129,300 | $231,100 |
| 2024 | $3,710 | $322,900 | $124,400 | $198,500 |
| 2023 | $3,666 | $298,800 | $106,600 | $192,200 |
| 2022 | $3,199 | $253,500 | $96,900 | $156,600 |
| 2021 | $3,195 | $231,000 | $89,700 | $141,300 |
| 2020 | $3,117 | $215,700 | $85,800 | $129,900 |
| 2019 | $3,085 | $211,600 | $81,700 | $129,900 |
| 2018 | $3,018 | $206,400 | $80,200 | $126,200 |
| 2017 | $2,642 | $188,700 | $81,900 | $106,800 |
| 2016 | $2,441 | $179,100 | $85,200 | $93,900 |
| 2015 | $2,332 | $178,300 | $82,100 | $96,200 |
| 2014 | $2,297 | $182,600 | $86,400 | $96,200 |
Source: Public Records
Map
Nearby Homes
- 10 Aberdeen St
- 21 Boyden St
- 248 Jefferson St
- 545 Brayton Ave
- 883 Grinnell St
- 118 Jefferson St
- 120 Jefferson St
- 889 Grinnell St Unit 7
- 889 Grinnell St Unit 8
- 889 Grinnell St Unit 2
- 1350 Rodman St
- 20 Reeves St
- 59 Denver St
- 71 Smith St
- 231 Lapham St
- 405 Warren St
- 495 Chicago St
- 472 Buffinton St (Ns)
- 311 S Oxford St
- 304 Cambridge St
Your Personal Tour Guide
Ask me questions while you tour the home.