Estimated Value: $905,436 - $1,244,000
4
Beds
4
Baths
3,735
Sq Ft
$279/Sq Ft
Est. Value
About This Home
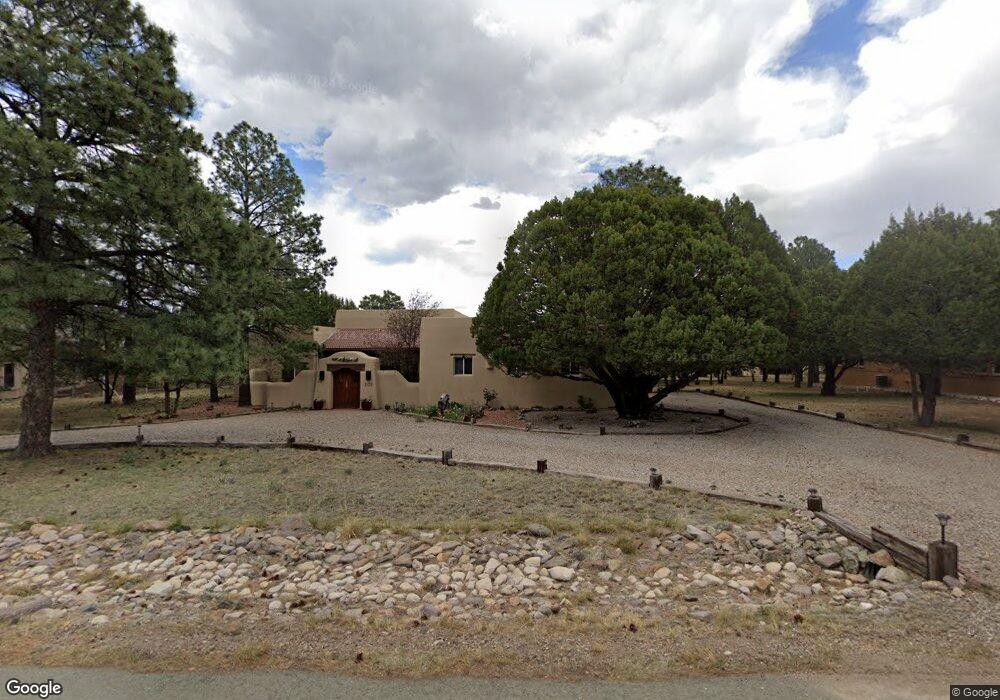
This home is located at 202 Quail Run Ln Unit 2, Alto, NM 88312 and is currently estimated at $1,041,145, approximately $278 per square foot. 202 Quail Run Ln Unit 2 is a home located in Lincoln County with nearby schools including Capitan Elementary School, Capitan Middle School, and Capitan High School.
Ownership History
Date
Name
Owned For
Owner Type
Purchase Details
Closed on
Nov 20, 2024
Sold by
Simpson Sean
Current Estimated Value
Purchase Details
Closed on
Aug 30, 2007
Sold by
Gordon Ron and Gordon Susanne
Bought by
Hetherington John and Hetherington Herta
Purchase Details
Closed on
Sep 29, 2005
Sold by
Silva Frank J and Silva Karen J
Bought by
Gordon Ron and Gordon Susanne
Home Financials for this Owner
Home Financials are based on the most recent Mortgage that was taken out on this home.
Original Mortgage
$310,000
Interest Rate
5.76%
Mortgage Type
New Conventional
Purchase Details
Closed on
Nov 15, 2004
Sold by
Silva Frank J and Silva Karen J
Bought by
Silva Frank J and Silva Karen J
Home Financials for this Owner
Home Financials are based on the most recent Mortgage that was taken out on this home.
Original Mortgage
$300,000
Interest Rate
5.74%
Mortgage Type
New Conventional
Create a Home Valuation Report for This Property
The Home Valuation Report is an in-depth analysis detailing your home's value as well as a comparison with similar homes in the area
Home Values in the Area
Average Home Value in this Area
Purchase History
| Date | Buyer | Sale Price | Title Company |
|---|---|---|---|
| -- | -- | None Listed On Document | |
| Hetherington John | -- | Gsv | |
| Gordon Ron | -- | None Available | |
| Silva Frank J | -- | None Available |
Source: Public Records
Mortgage History
| Date | Status | Borrower | Loan Amount |
|---|---|---|---|
| Previous Owner | Gordon Ron | $310,000 | |
| Previous Owner | Silva Frank J | $300,000 |
Source: Public Records
Tax History Compared to Growth
Tax History
| Year | Tax Paid | Tax Assessment Tax Assessment Total Assessment is a certain percentage of the fair market value that is determined by local assessors to be the total taxable value of land and additions on the property. | Land | Improvement |
|---|---|---|---|---|
| 2025 | $4,501 | $271,402 | $17,978 | $253,424 |
| 2024 | $4,501 | $263,497 | $17,454 | $246,043 |
| 2023 | $4,501 | $255,823 | $16,946 | $238,877 |
| 2022 | $3,802 | $248,371 | $16,452 | $231,919 |
| 2021 | $3,612 | $241,112 | $15,971 | $225,141 |
| 2020 | $4,009 | $234,090 | $15,506 | $218,584 |
| 2019 | $3,918 | $229,501 | $15,202 | $214,299 |
| 2018 | $3,715 | $218,386 | $14,760 | $203,626 |
| 2017 | $3,473 | $212,025 | $14,330 | $197,695 |
| 2015 | $3,492 | $205,870 | $13,914 | $191,956 |
| 2014 | $3,484 | $205,870 | $13,914 | $191,956 |
Source: Public Records
Map
Nearby Homes
- 103 Woodpine Ct Unit 2
- Lot 31E Flicker Ct
- 102 Quail Run Ln
- Lot 91 Deer Park Dr Unit 3
- 243 Deer Park Dr
- 202 Deer Park Dr
- 112 Woodpine Ct
- Lot 10A Stable Rd
- 217 Deer Park Dr
- 213 Fawn Dr
- 121 Stable Rd Unit 2
- T15B Partridge Ct
- Lot 3 Block 8
- Lot 9 Ute Ct
- 0 Stable Unit 132537
- L16D Gene Sarrasin Ct
- 102 Doe Ct
- Lot T24D Chickadee Ct Unit 4
- Lot 68 El Camino Dr
- 142 Deer Park Dr
- 108 Quail Run Ln Unit 2
- 204 Quail Run Ln Unit 2
- 191 Deer Park Dr Unit 2
- 191 Deer Park Dr
- 103 Flicker Ct
- 206 Quail Run Ln Unit 2
- 193 Deer Park Dr Unit 3
- 201 Quail Run Ln Unit 2
- 205 Quail Run Ln Unit 2
- 207 Flicker Ct
- 117 Quail Run Ln Unit 2
- 115 Quail Run Ln Unit 2
- 201 Flickerct Unit 3
- 208 Quail Run Ln
- 207 Quail Run Ln Unit 2
- 207 Quail Run Ln
- 121 Flicker Ct Unit 3
- 119 Flicker Ct Unit 3
- 117 Flicker Ct
- 115 Flicker Ct Unit 3