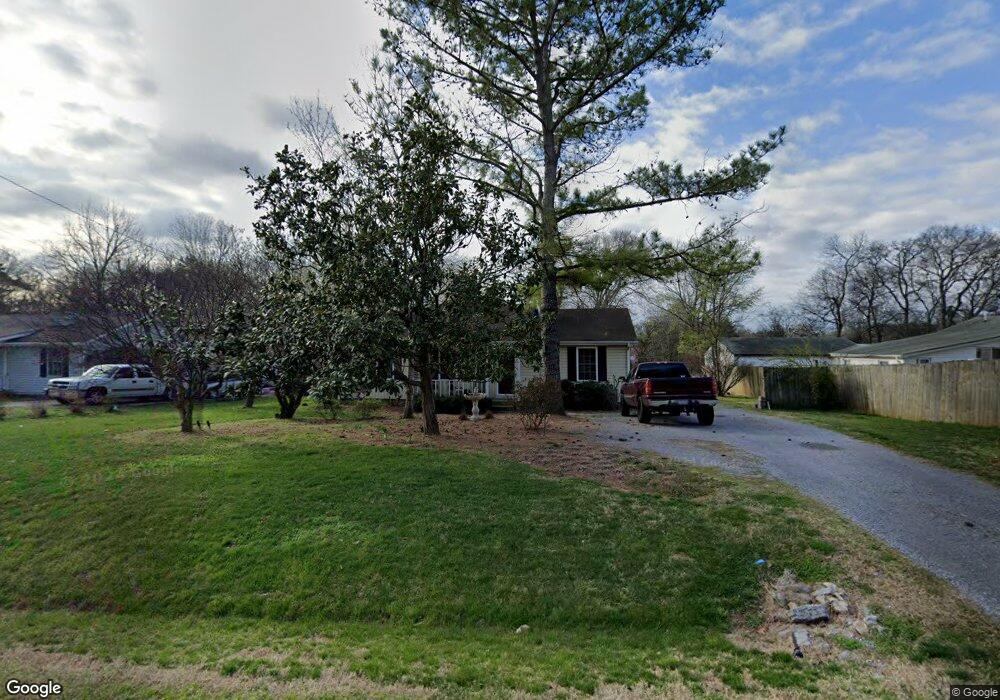
202 Rosswood Ct Smyrna, TN 37167
Estimated Value: $243,000 - $306,000
--
Bed
2
Baths
1,144
Sq Ft
$246/Sq Ft
Est. Value
About This Home
This home is located at 202 Rosswood Ct, Smyrna, TN 37167 and is currently estimated at $281,114, approximately $245 per square foot. 202 Rosswood Ct is a home located in Rutherford County with nearby schools including Stewarts Creek Elementary School, Stewarts Creek Middle School, and Stewarts Creek High School.
Ownership History
Date
Name
Owned For
Owner Type
Purchase Details
Closed on
Nov 23, 2019
Sold by
Bergstrom Devon L
Bought by
Bergstrom Devon L and Bergstrom Erica
Current Estimated Value
Home Financials for this Owner
Home Financials are based on the most recent Mortgage that was taken out on this home.
Original Mortgage
$125,000
Outstanding Balance
$84,193
Interest Rate
3.6%
Mortgage Type
New Conventional
Estimated Equity
$196,921
Purchase Details
Closed on
Sep 19, 2001
Sold by
R J Rentals
Bought by
Bergstrom Devon L
Home Financials for this Owner
Home Financials are based on the most recent Mortgage that was taken out on this home.
Original Mortgage
$89,194
Interest Rate
6.89%
Purchase Details
Closed on
Apr 20, 2001
Sold by
Loree Gerald M and Loree Rita M
Bought by
Rj Rentals
Purchase Details
Closed on
Jul 30, 1999
Sold by
Loree Gerald T
Bought by
Flanders and Lunda
Create a Home Valuation Report for This Property
The Home Valuation Report is an in-depth analysis detailing your home's value as well as a comparison with similar homes in the area
Home Values in the Area
Average Home Value in this Area
Purchase History
| Date | Buyer | Sale Price | Title Company |
|---|---|---|---|
| Bergstrom Devon L | -- | Title365 | |
| Bergstrom Devon L | $89,900 | -- | |
| Rj Rentals | $54,550 | -- | |
| Flanders | -- | -- |
Source: Public Records
Mortgage History
| Date | Status | Borrower | Loan Amount |
|---|---|---|---|
| Open | Bergstrom Devon L | $125,000 | |
| Closed | Flanders | $89,194 |
Source: Public Records
Tax History Compared to Growth
Tax History
| Year | Tax Paid | Tax Assessment Tax Assessment Total Assessment is a certain percentage of the fair market value that is determined by local assessors to be the total taxable value of land and additions on the property. | Land | Improvement |
|---|---|---|---|---|
| 2025 | $991 | $52,825 | $13,750 | $39,075 |
| 2024 | $991 | $52,825 | $13,750 | $39,075 |
| 2023 | $991 | $52,825 | $13,750 | $39,075 |
| 2022 | $866 | $53,575 | $13,750 | $39,825 |
| 2021 | $772 | $34,775 | $8,125 | $26,650 |
| 2020 | $772 | $34,775 | $8,125 | $26,650 |
| 2019 | $772 | $34,775 | $8,125 | $26,650 |
| 2018 | $730 | $34,775 | $0 | $0 |
| 2017 | $651 | $24,275 | $0 | $0 |
| 2016 | $651 | $24,275 | $0 | $0 |
| 2015 | $651 | $24,275 | $0 | $0 |
| 2014 | $604 | $24,275 | $0 | $0 |
| 2013 | -- | $22,850 | $0 | $0 |
Source: Public Records
Map
Nearby Homes
- 915 Hearthstone Ct
- 301 Gs Lee Blvd
- 305 Gs Lee Blvd
- 309 Gs Lee Blvd
- 313 Gs Lee Blvd
- 317 Gs Lee Blvd
- 321 Gs Lee Blvd
- 331 Gs Lee Blvd
- 335 Gs Lee Blvd
- 339 Gs Lee Blvd
- 343 Gs Lee Blvd
- 347 Gs Lee Blvd
- 351 Gs Lee Blvd
- 369 Gs Lee Blvd
- 373 Gs Lee Blvd
- 377 Gs Lee Blvd
- 5725 Seminary Rd
- 510 Lydia Ashley Ln
- 490 Lydia Ashley Ln
- 5660 Seminary Rd
- 204 Rosswood Ct
- 100 Rosswood Dr
- 206 Rosswood Ct
- 212 Rosswood Ct
- 214 Rosswood Ct
- 101 Neal Ave
- 5224 Seminary Rd
- 103 Neal Ave
- 101 Rosswood Dr
- 208 Rosswood Ct
- 210 Rosswood Ct
- 302 Olive Branch Ct
- 5088 Seminary Rd
- 5242 Seminary Rd
- 103 Rosswood Dr
- 5070 Seminary Rd
- 5071 Seminary Rd
- 5256 Seminary Rd
- 105 Rosswood Dr
- 102 Neal Ave