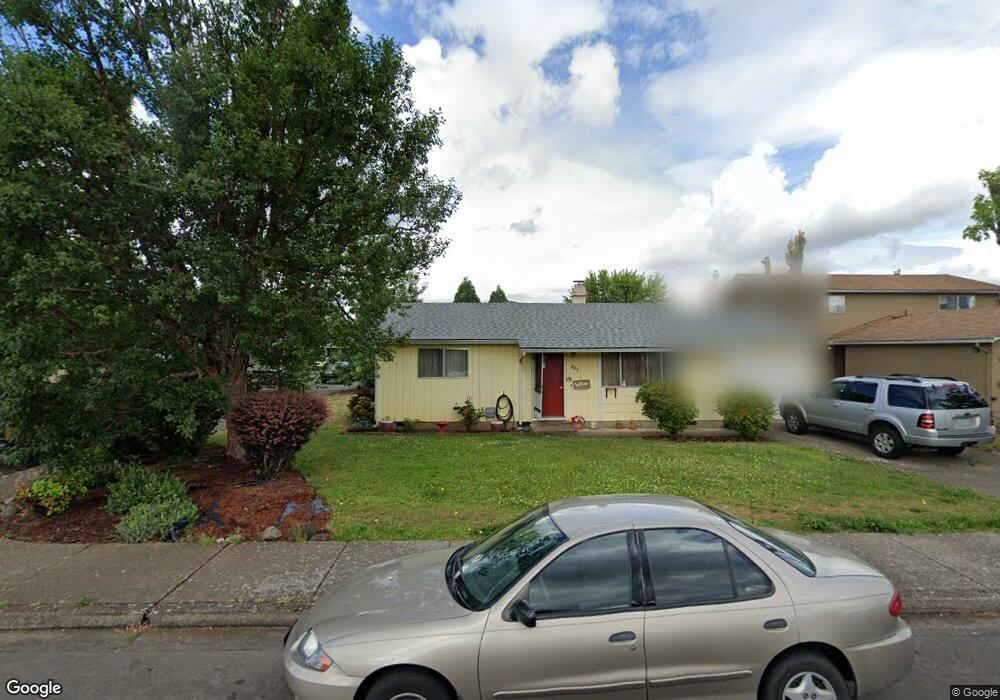
202 S 35th St Springfield, OR 97478
East Springfield NeighborhoodEstimated Value: $414,000 - $459,202
4
Beds
2
Baths
1,724
Sq Ft
$254/Sq Ft
Est. Value
About This Home
This home is located at 202 S 35th St, Springfield, OR 97478 and is currently estimated at $437,801, approximately $253 per square foot. 202 S 35th St is a home located in Lane County with nearby schools including Douglas Gardens Elementary School, Agnes Stewart Middle School, and Springfield High School.
Ownership History
Date
Name
Owned For
Owner Type
Purchase Details
Closed on
Aug 20, 2004
Sold by
Veenendaal Dale R and Veenendaal Dolores M
Bought by
Life Is An Adventure Llc
Current Estimated Value
Purchase Details
Closed on
May 13, 2004
Sold by
Godaert John and Godaert Esther H
Bought by
Veenendaal Dale R and Veenendaal Dolores M
Home Financials for this Owner
Home Financials are based on the most recent Mortgage that was taken out on this home.
Original Mortgage
$120,000
Interest Rate
5.5%
Mortgage Type
Purchase Money Mortgage
Create a Home Valuation Report for This Property
The Home Valuation Report is an in-depth analysis detailing your home's value as well as a comparison with similar homes in the area
Home Values in the Area
Average Home Value in this Area
Purchase History
| Date | Buyer | Sale Price | Title Company |
|---|---|---|---|
| Life Is An Adventure Llc | -- | -- | |
| Veenendaal Dale R | $150,000 | Western Title & Escrow Co |
Source: Public Records
Mortgage History
| Date | Status | Borrower | Loan Amount |
|---|---|---|---|
| Previous Owner | Veenendaal Dale R | $120,000 |
Source: Public Records
Tax History Compared to Growth
Tax History
| Year | Tax Paid | Tax Assessment Tax Assessment Total Assessment is a certain percentage of the fair market value that is determined by local assessors to be the total taxable value of land and additions on the property. | Land | Improvement |
|---|---|---|---|---|
| 2024 | $3,705 | $199,411 | -- | -- |
| 2023 | $3,705 | $193,603 | $0 | $0 |
| 2022 | $3,432 | $187,965 | $0 | $0 |
| 2021 | $3,370 | $182,491 | $0 | $0 |
| 2020 | $3,272 | $177,176 | $0 | $0 |
| 2019 | $3,173 | $172,016 | $0 | $0 |
| 2018 | $2,991 | $162,142 | $0 | $0 |
| 2017 | $2,877 | $162,142 | $0 | $0 |
| 2016 | $2,816 | $157,419 | $0 | $0 |
| 2015 | $2,736 | $152,834 | $0 | $0 |
| 2014 | $2,681 | $148,383 | $0 | $0 |
Source: Public Records
Map
Nearby Homes