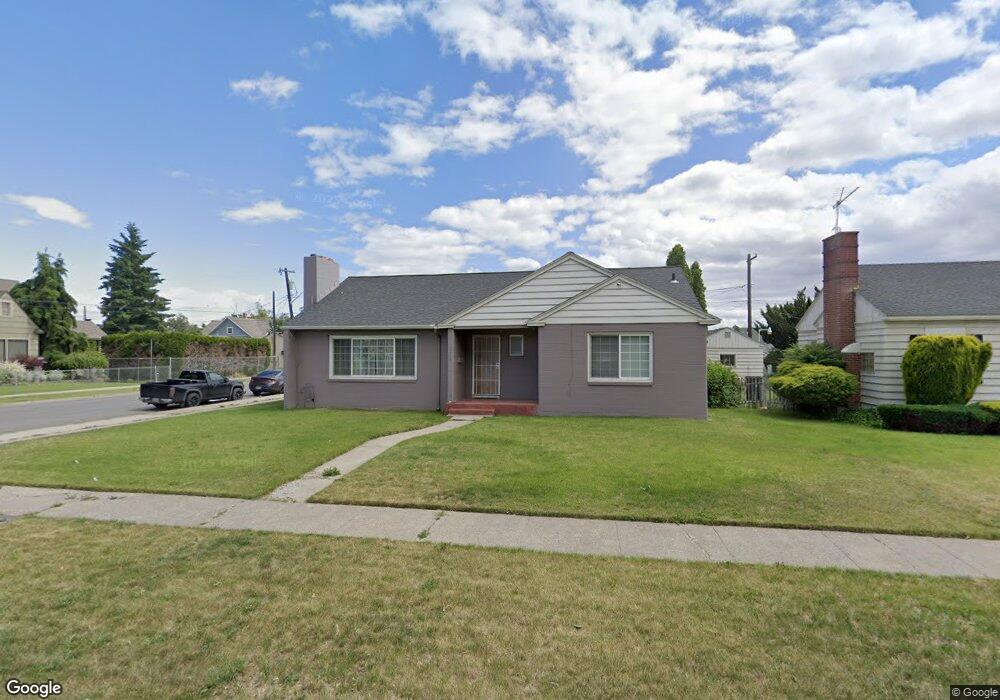
202 S Date St Toppenish, WA 98948
Estimated Value: $304,000 - $349,697
3
Beds
2
Baths
2,714
Sq Ft
$120/Sq Ft
Est. Value
About This Home
This home is located at 202 S Date St, Toppenish, WA 98948 and is currently estimated at $326,924, approximately $120 per square foot. 202 S Date St is a home located in Yakima County with nearby schools including Toppenish High School.
Ownership History
Date
Name
Owned For
Owner Type
Purchase Details
Closed on
Nov 30, 2022
Sold by
Shjerven Russell D and Shjerven Concepcion L
Bought by
White Kenya Janay
Current Estimated Value
Home Financials for this Owner
Home Financials are based on the most recent Mortgage that was taken out on this home.
Original Mortgage
$162,500
Outstanding Balance
$158,160
Interest Rate
6.61%
Mortgage Type
New Conventional
Estimated Equity
$168,764
Purchase Details
Closed on
Jun 19, 1997
Sold by
Ward Kimm M and Ward James F
Bought by
Shjerven Russell D and Shjerven Concepcion L Mayo
Home Financials for this Owner
Home Financials are based on the most recent Mortgage that was taken out on this home.
Original Mortgage
$86,904
Interest Rate
7.94%
Mortgage Type
FHA
Create a Home Valuation Report for This Property
The Home Valuation Report is an in-depth analysis detailing your home's value as well as a comparison with similar homes in the area
Home Values in the Area
Average Home Value in this Area
Purchase History
| Date | Buyer | Sale Price | Title Company |
|---|---|---|---|
| White Kenya Janay | -- | Schreiner Title | |
| Shjerven Russell D | $87,500 | Schreiner Title Company |
Source: Public Records
Mortgage History
| Date | Status | Borrower | Loan Amount |
|---|---|---|---|
| Open | White Kenya Janay | $162,500 | |
| Previous Owner | Mayo Shjerven Concepcion L | $110,500 | |
| Previous Owner | Shjerven Russell Dean | $124,000 | |
| Previous Owner | Shjerven Russell D | $129,600 | |
| Previous Owner | Shjerven Russell D | $45,165 | |
| Previous Owner | Shjerven Russell D | $42,984 | |
| Previous Owner | Shjerven Russell D | $86,904 |
Source: Public Records
Tax History Compared to Growth
Tax History
| Year | Tax Paid | Tax Assessment Tax Assessment Total Assessment is a certain percentage of the fair market value that is determined by local assessors to be the total taxable value of land and additions on the property. | Land | Improvement |
|---|---|---|---|---|
| 2025 | $2,673 | $312,100 | $33,900 | $278,200 |
| 2023 | $2,574 | $226,900 | $33,700 | $193,200 |
| 2022 | $2,207 | $195,900 | $33,600 | $162,300 |
| 2021 | $2,469 | $176,600 | $30,200 | $146,400 |
| 2019 | $1,717 | $147,200 | $27,100 | $120,100 |
| 2018 | $1,650 | $140,600 | $25,900 | $114,700 |
| 2017 | $1,408 | $134,600 | $25,900 | $108,700 |
| 2016 | $1,355 | $135,550 | $25,850 | $109,700 |
| 2015 | $1,355 | $128,050 | $25,850 | $102,200 |
| 2014 | $1,355 | $128,050 | $25,850 | $102,200 |
| 2013 | $1,355 | $128,050 | $25,850 | $102,200 |
Source: Public Records
Map
Nearby Homes
- 202 S Date St
- 204 S Date St
- 206 S Date St
- 308 Madison Ave
- 201 S Chestnut St
- 203 S Chestnut St
- 205 S Chestnut St
- 304 Madison Ave
- 401 Madison Ave
- 203 S Date St
- 208 S Date St
- 114 S Date St
- 207 S Chestnut St
- 115 S Chestnut St
- 115 S Date St
- 207 S Date St
- 209 S Chestnut St
- 210 S Date St
- 113 & 115 S Chestnut St
- 112 S Date St