Estimated Value: $442,471 - $493,000
--
Bed
--
Bath
2,936
Sq Ft
$160/Sq Ft
Est. Value
About This Home
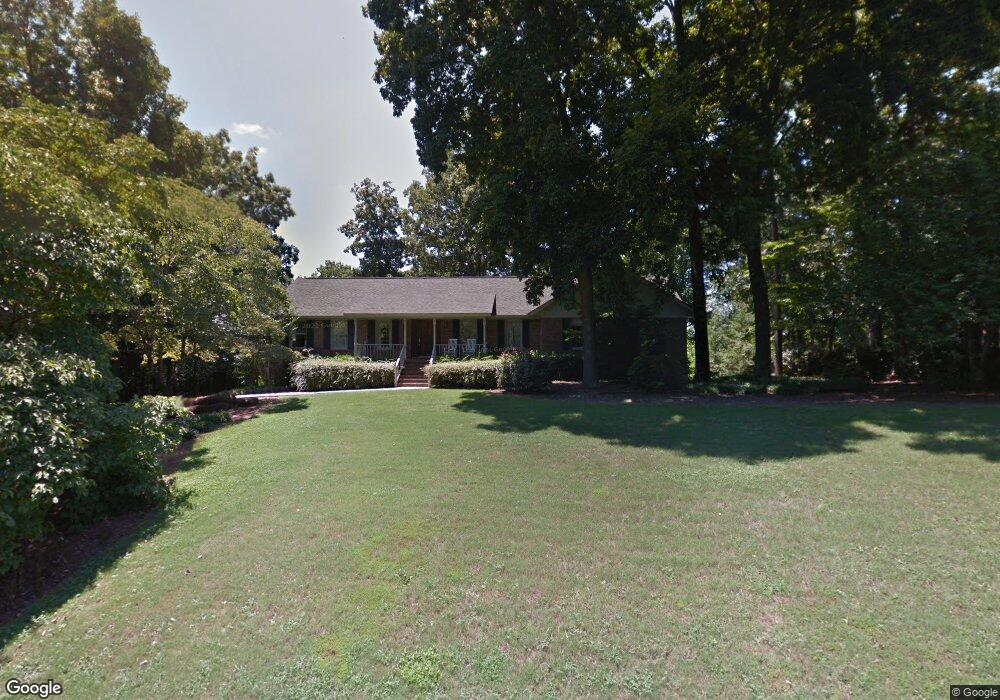
This home is located at 202 Saddle Mountain Rd SE, Rome, GA 30161 and is currently estimated at $470,368, approximately $160 per square foot. 202 Saddle Mountain Rd SE is a home located in Floyd County with nearby schools including Rome High School, Montessori School of Rome, and St. Mary School.
Ownership History
Date
Name
Owned For
Owner Type
Purchase Details
Closed on
Mar 19, 2020
Sold by
Dickson David
Bought by
Dickson David and Dickson Susan Mills
Current Estimated Value
Purchase Details
Closed on
Nov 1, 1993
Sold by
Ann Dickson
Bought by
Dickson David
Purchase Details
Closed on
May 1, 1985
Sold by
Rogers Hans Preston and Mary Lehey
Bought by
Dickson Charles H and Mary Ann
Purchase Details
Closed on
May 7, 1982
Sold by
Howell Adrian
Bought by
Rogers Hans Preston and Mary Lehey
Purchase Details
Closed on
Jul 14, 1978
Sold by
Mayes Thomas L
Bought by
Howell Adrian
Purchase Details
Closed on
May 20, 1978
Sold by
Bosworth Geo A and Bosworth Carol M
Bought by
Mayes Thomas L
Purchase Details
Closed on
Jun 22, 1972
Sold by
Howell Adrain and Covington James
Bought by
Bosworth Geo A and Bosworth Carol M
Purchase Details
Closed on
Apr 15, 1967
Bought by
Howell Adrain and Covington James
Create a Home Valuation Report for This Property
The Home Valuation Report is an in-depth analysis detailing your home's value as well as a comparison with similar homes in the area
Home Values in the Area
Average Home Value in this Area
Purchase History
| Date | Buyer | Sale Price | Title Company |
|---|---|---|---|
| Dickson David | -- | -- | |
| Dickson David | $79,000 | -- | |
| Dickson Charles H | $18,000 | -- | |
| Ann Dickson | -- | -- | |
| Rogers Hans Preston | $15,000 | -- | |
| Howell Adrian | $12,000 | -- | |
| Mayes Thomas L | $12,000 | -- | |
| Bosworth Geo A | $20,000 | -- | |
| Howell Adrain | -- | -- |
Source: Public Records
Tax History Compared to Growth
Tax History
| Year | Tax Paid | Tax Assessment Tax Assessment Total Assessment is a certain percentage of the fair market value that is determined by local assessors to be the total taxable value of land and additions on the property. | Land | Improvement |
|---|---|---|---|---|
| 2024 | $3,932 | $171,229 | $26,220 | $145,009 |
| 2023 | $3,903 | $169,661 | $23,460 | $146,201 |
| 2022 | $3,519 | $142,122 | $19,320 | $122,802 |
| 2021 | $4,057 | $129,624 | $17,940 | $111,684 |
| 2020 | $3,991 | $124,246 | $13,800 | $110,446 |
| 2019 | $3,679 | $108,403 | $13,800 | $94,603 |
| 2018 | $3,512 | $98,812 | $13,800 | $85,012 |
| 2017 | $3,445 | $94,974 | $13,800 | $81,174 |
| 2016 | $3,618 | $104,280 | $13,800 | $90,480 |
| 2015 | $3,320 | $98,560 | $13,800 | $84,760 |
| 2014 | $3,320 | $98,077 | $13,800 | $84,277 |
Source: Public Records
Map
Nearby Homes
- 333 Alfred Ave SE
- 409 Flora Ave SE
- 3010 Maple Rd SE
- 3014 Maple Rd SE
- 327 Flora Ave SE
- 2812 Maple Rd SE
- 33 Summit Dr
- 16 Summit Dr SE
- 226 Flora Ave SE
- 519 Dr SE
- 3 Belmont Ct SE
- 52 Twickenham Rd SE
- 15 Saddlebrook Dr SE
- 2508 Maple Rd SE
- 211 Chateau Dr SE
- 0 Wellington Way SE Unit 7374604
- 0 Wellington Way SE Unit 7374602
- 0 Wellington Way SE Unit 20180069
- 0 Wellington Way SE Unit 20180068
- 115 Hawthorne St SE
- 200 Saddle Mountain Rd SE
- 204 Saddle Mountain Rd SE
- 203 Saddle Mountain Rd SE
- 134 Saddle Mountain Rd SE Unit 66
- 134 Saddle Mountain Rd SE
- 205 Saddle Mountain Rd SE
- 201 Saddle Mountain Rd SE
- 206 Saddle Mountain Rd SE
- 135 Saddle Mountain Rd SE
- 208 Saddle Mountain Rd SE
- 132 Saddle Mountain Rd SE
- 6 Saddle Ln SE
- 411 Flora Ave Extension SE
- 411 Flora Ave Extension SE
- 409 Flora Ave Extension SE
- 409 Flora Ave Extension SE
- 413 Flora Ave Extension SE
- 133 Saddle Mountain Rd SE
- 209 Saddle Mountain Rd SE
- 415 Flora Ave Extension SE