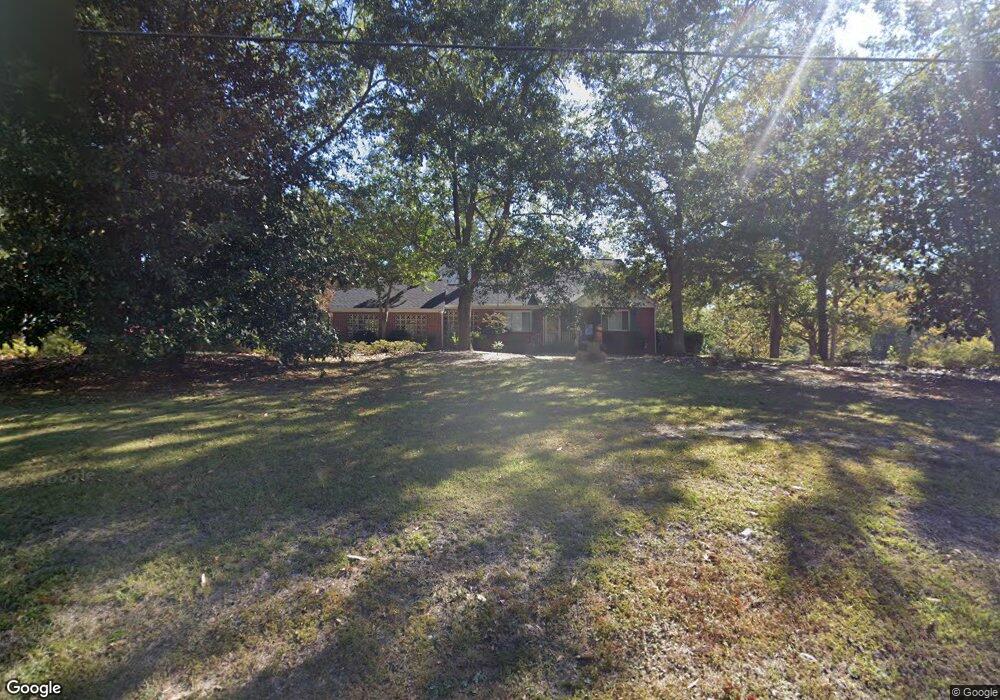
202 Skinner Rd Augusta, GA 30907
Montclair NeighborhoodEstimated Value: $347,649 - $511,000
3
Beds
2
Baths
2,906
Sq Ft
$140/Sq Ft
Est. Value
About This Home
This home is located at 202 Skinner Rd, Augusta, GA 30907 and is currently estimated at $405,550, approximately $139 per square foot. 202 Skinner Rd is a home located in Richmond County with nearby schools including First Coast Technical Institute, R.B. Hunt Elementary School, and Warren Road Elementary School.
Ownership History
Date
Name
Owned For
Owner Type
Purchase Details
Closed on
Apr 28, 2016
Sold by
Skinner Bruce Sheridan
Bought by
Sganga Michael and Sganga Sara
Current Estimated Value
Home Financials for this Owner
Home Financials are based on the most recent Mortgage that was taken out on this home.
Original Mortgage
$229,000
Outstanding Balance
$182,105
Interest Rate
3.71%
Mortgage Type
New Conventional
Estimated Equity
$223,445
Purchase Details
Closed on
Oct 12, 2005
Sold by
Timmerman Cathy Jean Skinner
Bought by
Skinner Bruce Sheridan
Home Financials for this Owner
Home Financials are based on the most recent Mortgage that was taken out on this home.
Original Mortgage
$60,617
Interest Rate
5.66%
Mortgage Type
Purchase Money Mortgage
Purchase Details
Closed on
Jan 25, 1990
Sold by
Skinner Harold S By Exrx
Bought by
Skinner Dorothy F
Create a Home Valuation Report for This Property
The Home Valuation Report is an in-depth analysis detailing your home's value as well as a comparison with similar homes in the area
Home Values in the Area
Average Home Value in this Area
Purchase History
| Date | Buyer | Sale Price | Title Company |
|---|---|---|---|
| Sganga Michael | $280,000 | -- | |
| Skinner Bruce Sheridan | $59,000 | -- | |
| Skinner Skinner Bruce Sheridan Bruce Sheridan | -- | -- | |
| Skinner Dorothy F | -- | -- |
Source: Public Records
Mortgage History
| Date | Status | Borrower | Loan Amount |
|---|---|---|---|
| Open | Sganga Michael | $229,000 | |
| Previous Owner | Skinner Skinner Bruce Sheridan Bruce Sheridan | $60,617 |
Source: Public Records
Tax History Compared to Growth
Tax History
| Year | Tax Paid | Tax Assessment Tax Assessment Total Assessment is a certain percentage of the fair market value that is determined by local assessors to be the total taxable value of land and additions on the property. | Land | Improvement |
|---|---|---|---|---|
| 2025 | $3,671 | $124,120 | $11,600 | $112,520 |
| 2024 | $3,671 | $127,768 | $11,600 | $116,168 |
| 2023 | $3,685 | $122,164 | $11,600 | $110,564 |
| 2022 | $2,652 | $85,568 | $11,600 | $73,968 |
| 2021 | $2,475 | $72,656 | $11,600 | $61,056 |
| 2020 | $2,436 | $72,656 | $11,600 | $61,056 |
| 2019 | $2,197 | $60,671 | $8,800 | $51,871 |
| 2018 | $2,212 | $60,671 | $8,800 | $51,871 |
| 2017 | $2,246 | $60,671 | $8,800 | $51,871 |
| 2016 | $2,419 | $60,946 | $9,504 | $51,442 |
| 2015 | $2,127 | $51,529 | $9,504 | $42,025 |
| 2014 | $2,129 | $51,529 | $9,504 | $42,025 |
Source: Public Records
Map
Nearby Homes
- 46 Charlestowne Dr
- 2695 York Dr
- 206 Warren Rd
- 26 Mulberry Ln
- 104 York Way
- 3103 Clay Hill Dr
- 3203 West Ct
- 150 Gardners Mill Rd
- 256 Hudson Trace
- 3084 Westwood Rd
- 3082 Westwood Rd
- 3086 Westwood Rd
- 2413 Woodbluff Ct
- 213 Kings Chapel Rd
- 3130 Village West Dr
- 151 Avondale Ct
- 2703 Oakbluff Ct
- 1405 Colony Place Dr
- 3305 Old Church Rd
- 2507 Pinebluff Ct
- 213 Tremont Way
- 204 Skinner Rd
- 209 Tremont Way
- 207 Tremont Way
- 214 Tremont Way
- 212 Tremont Way
- 210 Tremont Way
- 205 Skinner Rd
- 122 Skinner Rd
- 3101 Whaley Rd
- 208 Skinner Rd
- 205 Tremont Way
- 208 Tremont Way
- 207 Skinner Rd
- 207 Skinner Rd
- 226 Skinner Rd
- 120 Skinner Rd
- 206 Tremont Way
- 3103 Whaley Rd
- 203 Tremont Way