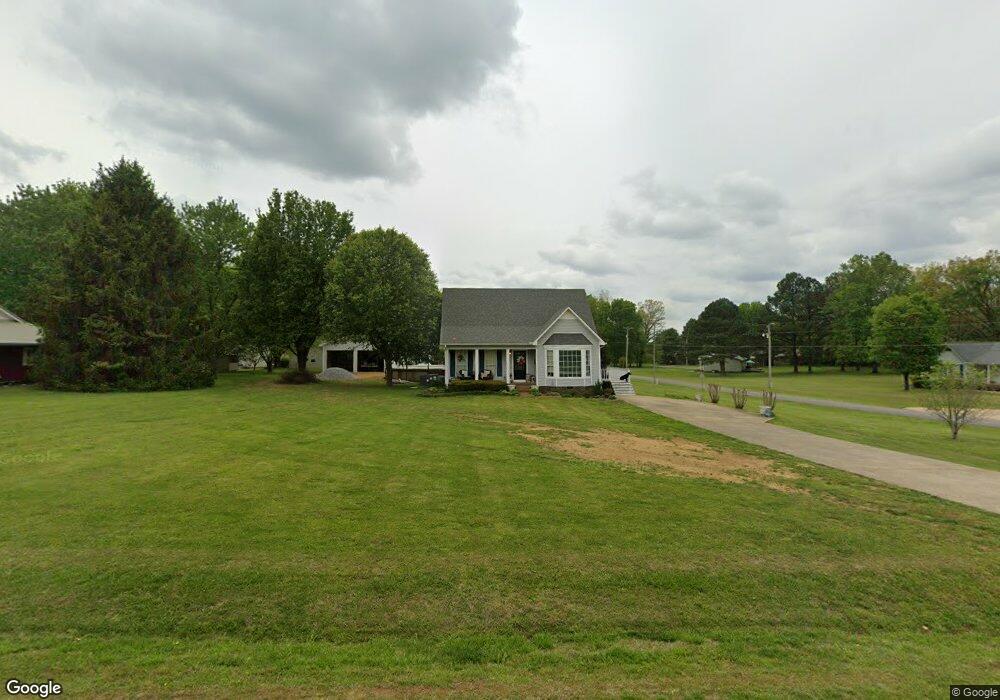
202 State Ave Lawrenceburg, TN 38464
Estimated Value: $218,906 - $320,000
--
Bed
2
Baths
1,222
Sq Ft
$213/Sq Ft
Est. Value
About This Home
This home is located at 202 State Ave, Lawrenceburg, TN 38464 and is currently estimated at $260,727, approximately $213 per square foot. 202 State Ave is a home located in Lawrence County with nearby schools including Ingram Sowell Elementary School, Lawrenceburg Public Elementary School, and David Crockett Elementary School.
Ownership History
Date
Name
Owned For
Owner Type
Purchase Details
Closed on
Jan 23, 2012
Bought by
Daughtry Megan L
Current Estimated Value
Home Financials for this Owner
Home Financials are based on the most recent Mortgage that was taken out on this home.
Original Mortgage
$88,000
Outstanding Balance
$60,301
Interest Rate
3.97%
Mortgage Type
Commercial
Estimated Equity
$200,426
Purchase Details
Closed on
Mar 9, 1999
Sold by
Short Donald M
Bought by
Megan Daughtry
Purchase Details
Closed on
Jan 25, 1996
Sold by
Shelton E O
Bought by
Short Donald M and Lee Tracy
Purchase Details
Closed on
Dec 25, 1992
Bought by
Shelton E O
Purchase Details
Closed on
Aug 17, 1990
Bought by
Braly Const Co Inc
Purchase Details
Closed on
Jun 9, 1982
Bought by
Fleeman John H and James Wesley
Create a Home Valuation Report for This Property
The Home Valuation Report is an in-depth analysis detailing your home's value as well as a comparison with similar homes in the area
Home Values in the Area
Average Home Value in this Area
Purchase History
| Date | Buyer | Sale Price | Title Company |
|---|---|---|---|
| Daughtry Megan L | -- | -- | |
| Frakes Megan L | -- | -- | |
| Megan Daughtry | $82,000 | -- | |
| Short Donald M | $77,500 | -- | |
| Shelton E O | $74,000 | -- | |
| Braly Const Co Inc | $6,500 | -- | |
| Fleeman John H | -- | -- |
Source: Public Records
Mortgage History
| Date | Status | Borrower | Loan Amount |
|---|---|---|---|
| Open | Frakes Megan L | $88,000 |
Source: Public Records
Tax History Compared to Growth
Tax History
| Year | Tax Paid | Tax Assessment Tax Assessment Total Assessment is a certain percentage of the fair market value that is determined by local assessors to be the total taxable value of land and additions on the property. | Land | Improvement |
|---|---|---|---|---|
| 2025 | $721 | $35,850 | $0 | $0 |
| 2024 | $721 | $35,850 | $5,000 | $30,850 |
| 2023 | $721 | $35,850 | $5,000 | $30,850 |
| 2022 | $721 | $35,850 | $5,000 | $30,850 |
| 2021 | $576 | $19,475 | $3,125 | $16,350 |
| 2020 | $576 | $19,475 | $3,125 | $16,350 |
| 2019 | $576 | $19,475 | $3,125 | $16,350 |
| 2018 | $576 | $19,475 | $3,125 | $16,350 |
| 2017 | $576 | $19,475 | $3,125 | $16,350 |
| 2016 | $576 | $19,475 | $3,125 | $16,350 |
| 2015 | $533 | $19,475 | $3,125 | $16,350 |
| 2014 | $505 | $18,450 | $3,125 | $15,325 |
Source: Public Records
Map
Nearby Homes
- 206 State Ave
- 2600 Clanton Rd
- 2342 Pulaski Hwy
- 260 Wesley Chapel Rd
- 111 Grandview Dr
- 786 Hillview Dr
- 2290 Grandview Dr
- 123 Quail Dr
- 79 Bishop Rd
- 107 Pond Dr
- 33 Bishop Rd
- 729 Weakley Creek Rd
- 380 Lanning Rd
- 1408 Baker Ln
- 1280 E Gaines St
- 1448 Baker Ln
- 1261 Brannon Rd
- 114 Hummingbird Ln
- 1111 Baker Ln
- 132 Sundance Dr
- 0 Millwood Dr
- 301 Forrest Ave
- 125 Millwood Dr
- 303 Forrest Ave
- 126 Millwood Dr
- 201 State Ave
- 127 Millwood Dr
- 305 Forrest Ave
- 123 Millwood Dr
- 205 State Ave
- 100 Cole Cir
- 302 Forrest Ave
- 208 State Ave
- 307 Forrest Ave
- 304 Forrest Ave
- 209 State Ave
- 122 Beechwood Dr
- 210 State Ave
- 133 Millwood Dr
- 308 Forrest Ave