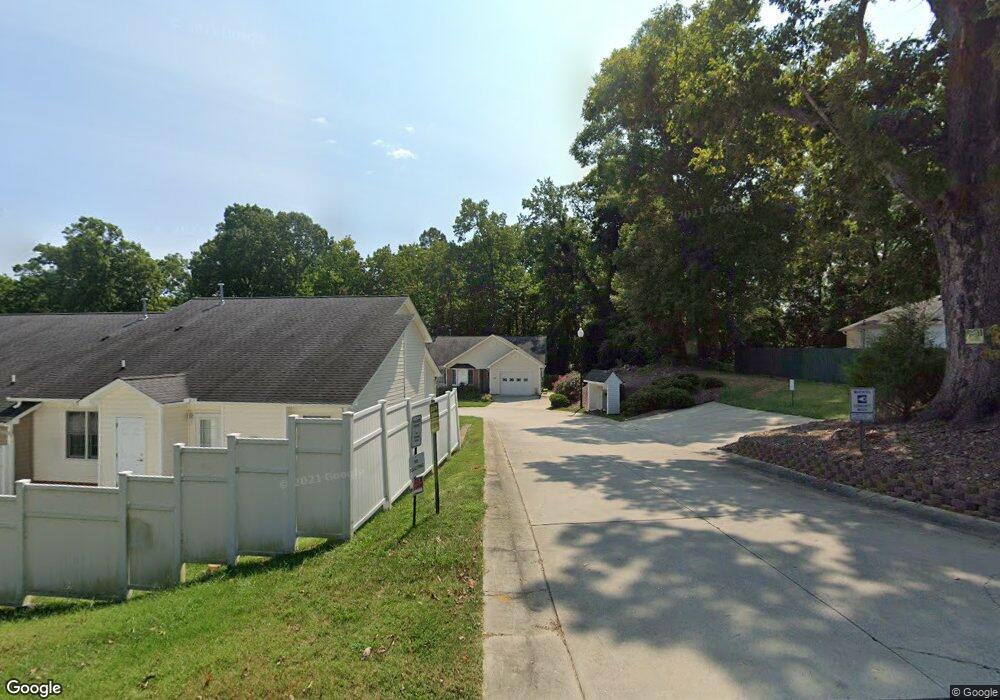
202 Stowe Ave Asheboro, NC 27203
Estimated Value: $242,000 - $261,000
--
Bed
2
Baths
1,460
Sq Ft
$171/Sq Ft
Est. Value
About This Home
This home is located at 202 Stowe Ave, Asheboro, NC 27203 and is currently estimated at $250,287, approximately $171 per square foot. 202 Stowe Ave is a home located in Randolph County with nearby schools including Lindley Park Elementary School, South Asheboro Middle School, and Asheboro High School.
Ownership History
Date
Name
Owned For
Owner Type
Purchase Details
Closed on
May 24, 2018
Sold by
Garrett A Byrd
Bought by
Hunter Matthew and Hunter Darcy
Current Estimated Value
Home Financials for this Owner
Home Financials are based on the most recent Mortgage that was taken out on this home.
Original Mortgage
$95,844
Outstanding Balance
$82,841
Interest Rate
4.66%
Estimated Equity
$167,446
Purchase Details
Closed on
Jul 28, 2011
Sold by
Robertson Theodore Hadley and Robertson Sylvia H
Bought by
Causey Judy Robbins
Purchase Details
Closed on
Mar 23, 2007
Sold by
Windermere Properties Inc
Bought by
Robertson Theodore Hadley and Robertson Sylvia H
Home Financials for this Owner
Home Financials are based on the most recent Mortgage that was taken out on this home.
Original Mortgage
$80,000
Interest Rate
6.22%
Mortgage Type
Purchase Money Mortgage
Create a Home Valuation Report for This Property
The Home Valuation Report is an in-depth analysis detailing your home's value as well as a comparison with similar homes in the area
Home Values in the Area
Average Home Value in this Area
Purchase History
| Date | Buyer | Sale Price | Title Company |
|---|---|---|---|
| Hunter Matthew | -- | -- | |
| Causey Judy Robbins | $128,500 | None Available | |
| Robertson Theodore Hadley | $121,500 | None Available |
Source: Public Records
Mortgage History
| Date | Status | Borrower | Loan Amount |
|---|---|---|---|
| Open | Hunter Matthew | $95,844 | |
| Closed | Hunter Matthew | -- | |
| Previous Owner | Robertson Theodore Hadley | $80,000 |
Source: Public Records
Tax History Compared to Growth
Tax History
| Year | Tax Paid | Tax Assessment Tax Assessment Total Assessment is a certain percentage of the fair market value that is determined by local assessors to be the total taxable value of land and additions on the property. | Land | Improvement |
|---|---|---|---|---|
| 2025 | $1,083 | $163,500 | $15,000 | $148,500 |
| 2024 | $1,083 | $163,500 | $15,000 | $148,500 |
| 2023 | $1,083 | $163,500 | $15,000 | $148,500 |
| 2022 | $916 | $127,130 | $12,000 | $115,130 |
| 2021 | $916 | $127,130 | $12,000 | $115,130 |
| 2020 | $916 | $127,130 | $12,000 | $115,130 |
| 2019 | $916 | $127,130 | $12,000 | $115,130 |
| 2018 | $956 | $130,300 | $13,500 | $116,800 |
| 2016 | $982 | $130,302 | $13,500 | $116,802 |
| 2015 | $983 | $130,302 | $13,500 | $116,802 |
| 2014 | -- | $130,302 | $13,500 | $116,802 |
Source: Public Records
Map
Nearby Homes
- 350 Stowe Ave Unit 101
- 1002 Cliff Rd
- 922 S Cox St
- 822 Glenwood Rd
- 209 Armfield Ave
- 211 Armfield Ave
- 0 U S Highway 64
- 604 Hemlock Dr
- 1427 S Fayetteville St
- 602 Highland St
- 500 E Kivett St
- 815 Trollinger Rd
- 640 Hemlock Dr
- 643 Cypress Dr
- 412 Cliff Rd
- 741 Kildare Rd
- 960 Lee St
- 855 Lee St
- 1236 Pepperidge Rd
- 0 Sequoia Ave
- 402 Stowe Ave
- 320 Stowe Ave
- 401 Stowe Ave
- 316 Stowe Ave
- 983 Straight St
- 350 Stowe Ave
- 350 Stowe Ave
- 350 Stowe Ave
- 350 Stowe Ave
- 350 Stowe Ave Unit 302
- 350 Stowe Ave Unit 602
- 350 Stowe Ave Unit 701
- 350 Stowe Ave Unit 801
- 350 Stowe Ave Unit 702
- 350 Stowe Ave Unit 802
- 350 Stowe Ave Unit 301
- 350 Stowe Ave Unit 601
- 350 Stowe Ave Unit 501
- 350 Stowe Ave Unit 202
- 350 Stowe Ave Unit 402