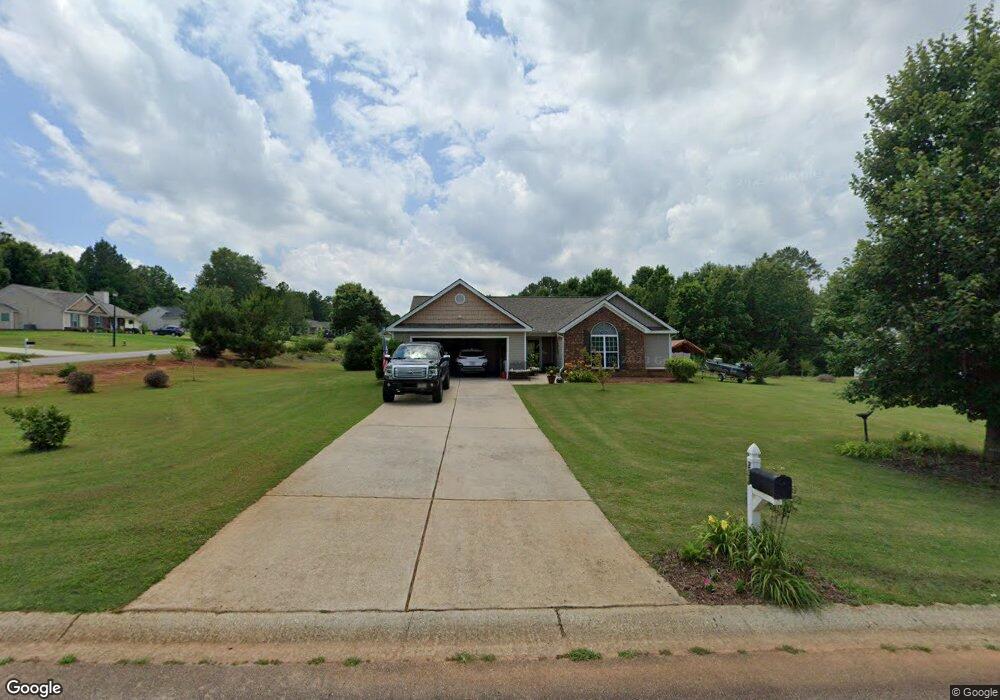
202 Stream Side Ct Winder, GA 30680
Estimated Value: $346,748 - $374,000
3
Beds
3
Baths
1,954
Sq Ft
$183/Sq Ft
Est. Value
About This Home
This home is located at 202 Stream Side Ct, Winder, GA 30680 and is currently estimated at $358,187, approximately $183 per square foot. 202 Stream Side Ct is a home located in Barrow County with nearby schools including Statham Elementary School, Bear Creek Middle School, and Winder-Barrow High School.
Ownership History
Date
Name
Owned For
Owner Type
Purchase Details
Closed on
Jul 24, 2015
Sold by
Ruckman Angela M
Bought by
Bowles Sonjie W
Current Estimated Value
Home Financials for this Owner
Home Financials are based on the most recent Mortgage that was taken out on this home.
Original Mortgage
$131,632
Outstanding Balance
$102,426
Interest Rate
4.04%
Mortgage Type
Commercial
Estimated Equity
$255,761
Purchase Details
Closed on
Feb 8, 2006
Sold by
Star Hm Builders Inc
Bought by
Ruckman Angela M
Home Financials for this Owner
Home Financials are based on the most recent Mortgage that was taken out on this home.
Original Mortgage
$111,900
Interest Rate
6.14%
Mortgage Type
New Conventional
Purchase Details
Closed on
Mar 24, 2005
Sold by
Hkb Inc
Bought by
Star Home Builders Inc
Home Financials for this Owner
Home Financials are based on the most recent Mortgage that was taken out on this home.
Original Mortgage
$115,200
Interest Rate
5.62%
Purchase Details
Closed on
Jul 25, 2002
Bought by
Hkb Inc
Create a Home Valuation Report for This Property
The Home Valuation Report is an in-depth analysis detailing your home's value as well as a comparison with similar homes in the area
Home Values in the Area
Average Home Value in this Area
Purchase History
| Date | Buyer | Sale Price | Title Company |
|---|---|---|---|
| Bowles Sonjie W | $129,000 | -- | |
| Ruckman Angela M | $139,900 | -- | |
| Star Home Builders Inc | $35,000 | -- | |
| Hkb Inc | -- | -- |
Source: Public Records
Mortgage History
| Date | Status | Borrower | Loan Amount |
|---|---|---|---|
| Open | Bowles Sonjie W | $131,632 | |
| Previous Owner | Ruckman Angela M | $111,900 | |
| Previous Owner | Ruckman Angela M | $27,980 | |
| Previous Owner | Star Home Builders Inc | $115,200 |
Source: Public Records
Tax History
| Year | Tax Paid | Tax Assessment Tax Assessment Total Assessment is a certain percentage of the fair market value that is determined by local assessors to be the total taxable value of land and additions on the property. | Land | Improvement |
|---|---|---|---|---|
| 2025 | $950 | $121,011 | $26,800 | $94,211 |
| 2024 | $1,651 | $118,206 | $26,800 | $91,406 |
| 2023 | $1,036 | $109,296 | $25,200 | $84,096 |
| 2022 | $939 | $84,520 | $18,000 | $66,520 |
| 2021 | $845 | $77,500 | $18,000 | $59,500 |
| 2020 | $753 | $70,220 | $16,000 | $54,220 |
| 2019 | $784 | $70,220 | $16,000 | $54,220 |
| 2018 | $675 | $63,540 | $14,000 | $49,540 |
| 2017 | $1,513 | $51,948 | $14,000 | $37,948 |
| 2016 | $462 | $46,860 | $14,000 | $32,860 |
| 2015 | $1,403 | $47,217 | $14,000 | $33,217 |
| 2014 | $1,207 | $40,434 | $6,860 | $33,574 |
| 2013 | -- | $41,741 | $6,860 | $34,881 |
Source: Public Records
Map
Nearby Homes
- 113 Platte St
- 0
- 1295 Double Bridges Rd
- 207 Cedar Grove Church Rd
- 670 Cedar Grove Church Rd
- 670 Cedar Grove Church Rd
- 233 Hunter Rd
- 3845 S Highway 82
- 144 Briar Rose Blvd
- 123 Briar Rose Blvd
- 1453 Solomon Dr
- 41 Lavender Rd
- 16 Fox Dr
- 142 Defilippe Dr
- 0 Berch Tree Trail Unit LOT 12
- 0 Berch Tree Trail Unit LOT 7
- 0 Berch Tree Trail Unit 7665580
- 0 Berch Tree Trail Unit 7665573
- 102 Richmond Dr
- Tract 3 Ethridge Rd
- 204 Stream Side Ct
- 204 Stream Unit Ct
- 1668-1696 Bismarck Cir Unit 34-38
- 1620 Bismarck Cir
- 201 Stream Side Ct
- 1625 Bismarck Cir
- 205 Stream Side Ct
- 1621 Bismarck Cir Unit 17
- 1621 Bismarck Cir
- 1627 Bismarck Cir Unit 19
- 1627 Bismarck Cir
- 1616 Bismarck Cir
- 208 Stream Side Ct Unit Ct
- 208 Stream Side Ct
- 1629 Bismarck Cir Unit 20
- 1629 Bismarck Cir
- 1619 Bismarck Cir
- 1411 Blanding Way
- 209 Stream Unit Ct
- 209 Stream Side Ct Unit Ct
Your Personal Tour Guide
Ask me questions while you tour the home.