Estimated Value: $420,000 - $524,000
2
Beds
1
Bath
1,150
Sq Ft
$389/Sq Ft
Est. Value
About This Home
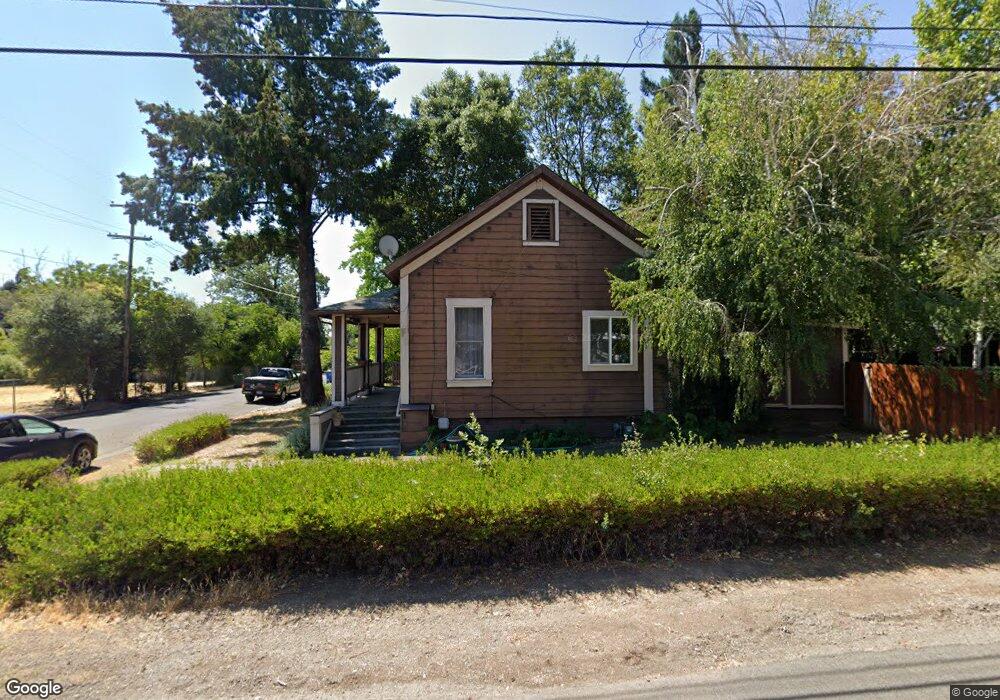
This home is located at 202 Thompson St, Ukiah, CA 95482 and is currently estimated at $447,305, approximately $388 per square foot. 202 Thompson St is a home located in Mendocino County with nearby schools including Yokayo Elementary School, Pomolita Middle School, and Ukiah High School.
Ownership History
Date
Name
Owned For
Owner Type
Purchase Details
Closed on
May 21, 2013
Sold by
Kramer Andrew E
Bought by
Kramer Andrew E and Nemtsova Anna
Current Estimated Value
Home Financials for this Owner
Home Financials are based on the most recent Mortgage that was taken out on this home.
Original Mortgage
$177,375
Outstanding Balance
$125,599
Interest Rate
3.54%
Mortgage Type
New Conventional
Estimated Equity
$321,706
Purchase Details
Closed on
Mar 29, 2013
Sold by
Mccoy Patrick Anthony
Bought by
Kramer Andrew E
Home Financials for this Owner
Home Financials are based on the most recent Mortgage that was taken out on this home.
Original Mortgage
$177,375
Outstanding Balance
$125,599
Interest Rate
3.54%
Mortgage Type
New Conventional
Estimated Equity
$321,706
Purchase Details
Closed on
Feb 5, 2013
Sold by
Nemtsova Anna
Bought by
Kramer Andrew
Home Financials for this Owner
Home Financials are based on the most recent Mortgage that was taken out on this home.
Original Mortgage
$177,375
Outstanding Balance
$125,599
Interest Rate
3.54%
Mortgage Type
New Conventional
Estimated Equity
$321,706
Purchase Details
Closed on
Jan 23, 2007
Sold by
Mccoy Margaret L
Bought by
Revocabl Mccoy Margaret L
Create a Home Valuation Report for This Property
The Home Valuation Report is an in-depth analysis detailing your home's value as well as a comparison with similar homes in the area
Home Values in the Area
Average Home Value in this Area
Purchase History
| Date | Buyer | Sale Price | Title Company |
|---|---|---|---|
| Kramer Andrew E | -- | First American Title Company | |
| Kramer Andrew E | $236,500 | First American Title Company | |
| Kramer Andrew | -- | First American Title Company | |
| Revocabl Mccoy Margaret L | -- | None Available |
Source: Public Records
Mortgage History
| Date | Status | Borrower | Loan Amount |
|---|---|---|---|
| Open | Kramer Andrew E | $177,375 |
Source: Public Records
Tax History Compared to Growth
Tax History
| Year | Tax Paid | Tax Assessment Tax Assessment Total Assessment is a certain percentage of the fair market value that is determined by local assessors to be the total taxable value of land and additions on the property. | Land | Improvement |
|---|---|---|---|---|
| 2025 | $3,507 | $291,218 | $110,821 | $180,397 |
| 2023 | $3,507 | $279,912 | $106,519 | $173,393 |
| 2022 | $3,361 | $274,425 | $104,431 | $169,994 |
| 2021 | $3,258 | $269,045 | $102,384 | $166,661 |
| 2020 | $3,211 | $266,289 | $101,336 | $164,953 |
| 2019 | $3,031 | $261,070 | $99,350 | $161,720 |
| 2018 | $2,956 | $255,953 | $97,403 | $158,550 |
| 2017 | $2,908 | $250,934 | $95,493 | $155,441 |
| 2016 | $2,822 | $246,015 | $93,621 | $152,394 |
| 2015 | $2,799 | $242,320 | $92,215 | $150,105 |
| 2014 | $2,734 | $237,574 | $90,409 | $147,165 |
Source: Public Records
Map
Nearby Homes
- 416 Oak Park Ave
- 1247 Myszka Place
- 1124 W Standley St
- 150 Calvert Ct
- 433 Park Blvd
- 605 Jones St
- 530 W Stephenson St
- 674 Willow Ave
- 1216 W Standley St
- 831 Cypress Ave
- 336 W Mill St
- 205 W Clay St
- 693 Mendocino Dr
- 161 Barbara St
- 402 Grove Ave
- 0 N School St Unit 325003830
- 810 Mendocino Dr
- 850 Mendocino Dr
- 1025 Alice Ave
- 970 N Pine St
- 206 Thompson St
- 1105 W Church St
- 100 Thompson St
- 1106 W Church St
- 1108 W Church St
- 212 Thompson St
- 1107 W Church St
- 175 Thompson St
- 1101 W Perkins St
- 1080 W Church St
- 1109 W Church St
- 1120 W Church St
- 1103 W Perkins St
- 1080 W Church St
- 218 Thompson St
- 1109 W Perkins St
- 1023 W Perkins St
- 215 Thompson St
- 191 Clay Place
- 1020 W Church St