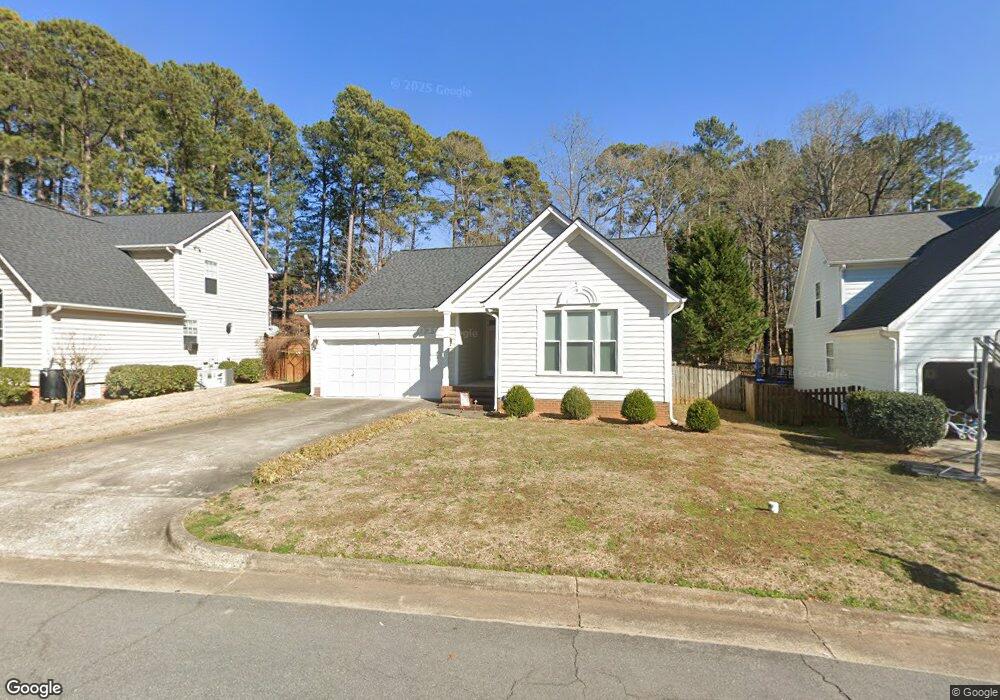
202 Trailview Dr Cary, NC 27513
West Cary NeighborhoodEstimated Value: $481,000 - $505,000
3
Beds
2
Baths
1,650
Sq Ft
$300/Sq Ft
Est. Value
About This Home
This home is located at 202 Trailview Dr, Cary, NC 27513 and is currently estimated at $495,193, approximately $300 per square foot. 202 Trailview Dr is a home located in Wake County with nearby schools including Laurel Park Elementary, Salem Middle, and Green Hope High.
Ownership History
Date
Name
Owned For
Owner Type
Purchase Details
Closed on
Dec 12, 2005
Sold by
Coppedge Sarah
Bought by
Griffin Katherine L
Current Estimated Value
Home Financials for this Owner
Home Financials are based on the most recent Mortgage that was taken out on this home.
Original Mortgage
$159,600
Outstanding Balance
$88,286
Interest Rate
6.1%
Mortgage Type
Fannie Mae Freddie Mac
Estimated Equity
$406,907
Purchase Details
Closed on
Aug 29, 2003
Sold by
Patalano Louis and Patalano Jodi
Bought by
Coppedge Thomas and Coppedge Sarah
Home Financials for this Owner
Home Financials are based on the most recent Mortgage that was taken out on this home.
Original Mortgage
$150,400
Interest Rate
4.12%
Mortgage Type
Purchase Money Mortgage
Purchase Details
Closed on
Aug 9, 2000
Sold by
Graves James Andrew
Bought by
Patalano Louis and Patalano Jodi
Home Financials for this Owner
Home Financials are based on the most recent Mortgage that was taken out on this home.
Original Mortgage
$140,000
Interest Rate
8.23%
Create a Home Valuation Report for This Property
The Home Valuation Report is an in-depth analysis detailing your home's value as well as a comparison with similar homes in the area
Home Values in the Area
Average Home Value in this Area
Purchase History
We collect this data history from publicly available records. To have your information removed, we recommend requesting removal directly through your county’s website.
| Date | Buyer | Sale Price | Title Company |
|---|---|---|---|
| Griffin Katherine L | $199,500 | None Available | |
| Coppedge Thomas | $188,000 | -- | |
| Patalano Louis | $175,000 | -- |
Source: Public Records
Mortgage History
We collect this data history from publicly available records. To have your information removed, we recommend requesting removal directly through your county’s website.
| Date | Status | Borrower | Loan Amount |
|---|---|---|---|
| Open | Griffin Katherine L | $159,600 | |
| Previous Owner | Coppedge Thomas | $150,400 | |
| Previous Owner | Patalano Louis | $140,000 | |
| Closed | Patalano Louis | $26,250 |
Source: Public Records
Tax History
| Year | Tax Paid | Tax Assessment Tax Assessment Total Assessment is a certain percentage of the fair market value that is determined by local assessors to be the total taxable value of land and additions on the property. | Land | Improvement |
|---|---|---|---|---|
| 2025 | $4,017 | $466,396 | $165,000 | $301,396 |
| 2024 | $3,931 | $466,396 | $165,000 | $301,396 |
| 2023 | $3,326 | $329,958 | $105,000 | $224,958 |
| 2022 | $3,202 | $329,958 | $105,000 | $224,958 |
| 2021 | $3,138 | $329,958 | $105,000 | $224,958 |
| 2020 | $3,155 | $329,958 | $105,000 | $224,958 |
| 2019 | $2,761 | $255,966 | $88,000 | $167,966 |
| 2018 | $2,591 | $255,966 | $88,000 | $167,966 |
| 2017 | $2,490 | $255,966 | $88,000 | $167,966 |
| 2016 | $2,453 | $255,966 | $88,000 | $167,966 |
| 2015 | $2,264 | $227,976 | $60,000 | $167,976 |
| 2014 | $2,136 | $227,976 | $60,000 | $167,976 |
Source: Public Records
Map
Nearby Homes
- 119 Trailview Dr
- 100 Trailview Dr
- 112 Bebington Dr
- 112 Conway Ct
- 106 Stokesay Ct
- 127 Maldon Dr
- 403 Accolade Dr
- 330 Bond Lake Dr
- 222 Custer Trail
- 128 Wheatsbury Dr
- 101 Kiawah Dr
- 102 Medallion Cir
- 100 Arlington Ridge
- 701 Royal Tower Way
- 302 Halls Mill Dr
- 110 Mereworth Place
- 208 Arlington Ridge
- 120 Plyersmill Rd
- 402 Sherwood Forest Place
- 121 Marquette Dr
- 204 Trailview Dr
- 200 Trailview Dr
- 103 Glensford Way
- 120 Haddonfield Ln
- 206 Trailview Dr
- 118 Haddonfield Ln
- 122 Haddonfield Ln
- 116 Haddonfield Ln
- 203 Trailview Dr
- 201 Trailview Dr
- 105 Glensford Way
- 205 Trailview Dr
- 114 Haddonfield Ln
- 100 Glensford Way
- 123 Trailview Dr
- 207 Trailview Dr
- 208 Ashley Brook Ct
- 124 Haddonfield Ln
- 210 Trailview Dr
- 206 Ashley Brook Ct
Your Personal Tour Guide
Ask me questions while you tour the home.