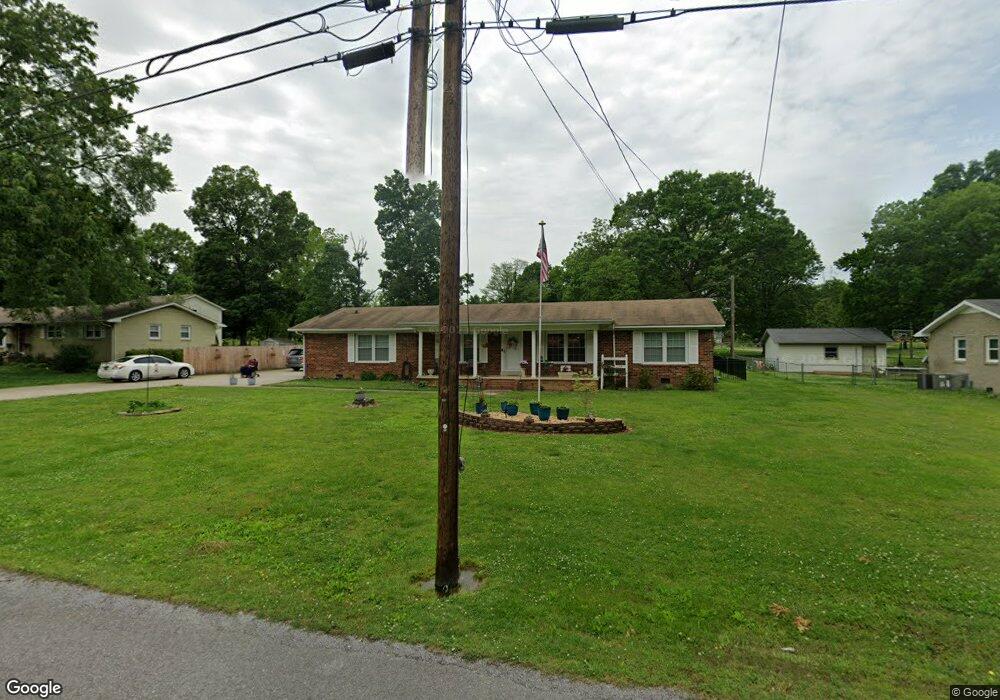
202 Tremont Dr Shelbyville, TN 37160
Estimated Value: $236,061 - $314,000
--
Bed
2
Baths
1,728
Sq Ft
$156/Sq Ft
Est. Value
About This Home
This home is located at 202 Tremont Dr, Shelbyville, TN 37160 and is currently estimated at $269,265, approximately $155 per square foot. 202 Tremont Dr is a home located in Bedford County with nearby schools including Harris Middle School and Victory Baptist Academy.
Ownership History
Date
Name
Owned For
Owner Type
Purchase Details
Closed on
Aug 8, 2003
Sold by
Walker John and Walker Catherine
Bought by
Rodgers Jerry and Rodgers Donna
Current Estimated Value
Purchase Details
Closed on
Mar 16, 1988
Bought by
Walker Catherine Harrub
Purchase Details
Closed on
Dec 18, 1971
Bought by
Harrub Calvin N and Harrub Catherine
Create a Home Valuation Report for This Property
The Home Valuation Report is an in-depth analysis detailing your home's value as well as a comparison with similar homes in the area
Home Values in the Area
Average Home Value in this Area
Purchase History
| Date | Buyer | Sale Price | Title Company |
|---|---|---|---|
| Rodgers Jerry | $86,000 | -- | |
| Harrub Catherine | -- | -- | |
| Walker Catherine Harrub | -- | -- | |
| Harrub Calvin N | -- | -- |
Source: Public Records
Tax History Compared to Growth
Tax History
| Year | Tax Paid | Tax Assessment Tax Assessment Total Assessment is a certain percentage of the fair market value that is determined by local assessors to be the total taxable value of land and additions on the property. | Land | Improvement |
|---|---|---|---|---|
| 2025 | -- | $44,025 | $0 | $0 |
| 2024 | -- | $44,025 | $4,525 | $39,500 |
| 2023 | $1,676 | $44,025 | $4,525 | $39,500 |
| 2022 | $1,724 | $44,025 | $4,525 | $39,500 |
| 2021 | $1,565 | $44,025 | $4,525 | $39,500 |
| 2020 | $1,344 | $44,025 | $4,525 | $39,500 |
| 2019 | $1,344 | $30,325 | $3,625 | $26,700 |
| 2018 | $1,313 | $30,325 | $3,625 | $26,700 |
| 2017 | $1,313 | $30,325 | $3,625 | $26,700 |
| 2016 | $1,301 | $30,325 | $3,625 | $26,700 |
| 2015 | $1,301 | $30,325 | $3,625 | $26,700 |
| 2014 | $1,253 | $31,956 | $0 | $0 |
Source: Public Records
Map
Nearby Homes
- 1404 Cypress St
- 1683 Madison St
- 204 S Hillcrest Dr
- 1725 Wartrace Pike
- 225 Eagle Blvd
- 705 S Wall St
- 707 S Wall St
- 2021 Madison St
- 711 S Wall St
- 719 S Wall St
- 715 S Wall St
- 713 S Wall St
- 104 Townsend Ave
- 207 Ledbetter Rd
- 1024 Tennessee 64
- 404 Ledbetter Rd
- 218 Wall St
- 104 Curbow Ct
- 148 Maupin Cir
- 2212 Patricia Dr