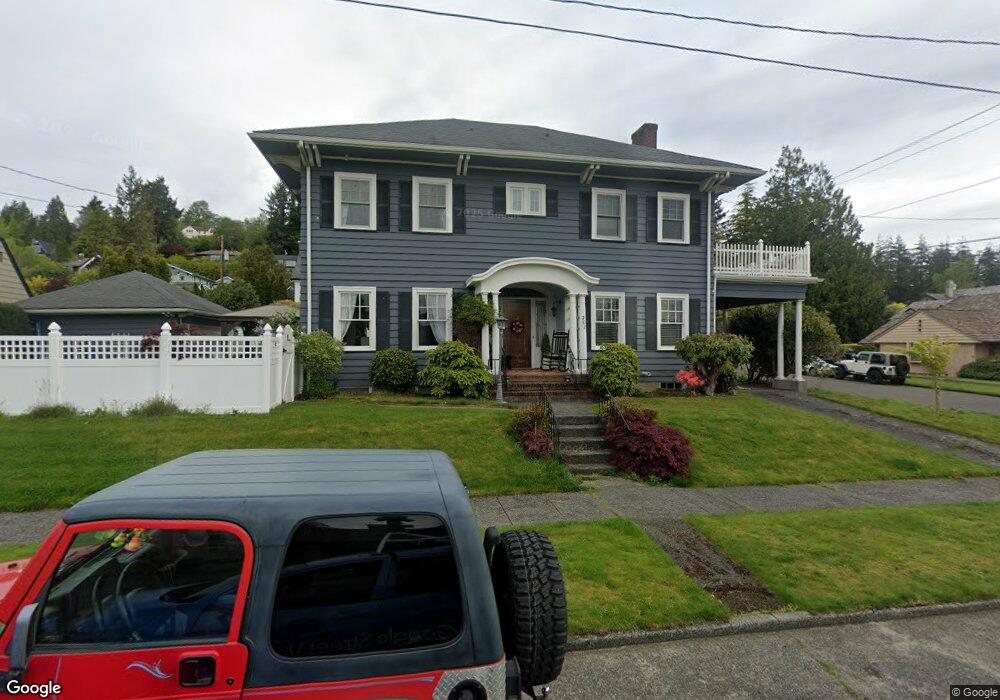
202 W 9th St Aberdeen, WA 98520
Estimated Value: $433,000 - $541,000
4
Beds
3
Baths
3,511
Sq Ft
$134/Sq Ft
Est. Value
About This Home
This home is located at 202 W 9th St, Aberdeen, WA 98520 and is currently estimated at $470,294, approximately $133 per square foot. 202 W 9th St is a home located in Grays Harbor County with nearby schools including McDermoth Elementary School, Miller Junior High School, and J.M. Weatherwax High School.
Ownership History
Date
Name
Owned For
Owner Type
Purchase Details
Closed on
Feb 24, 2010
Sold by
Federal Home Loan Mortgage Corporation
Bought by
Capoeman Joseph Charles and Capoeman Leslie
Current Estimated Value
Home Financials for this Owner
Home Financials are based on the most recent Mortgage that was taken out on this home.
Original Mortgage
$207,668
Outstanding Balance
$137,981
Interest Rate
5.03%
Mortgage Type
FHA
Estimated Equity
$332,313
Purchase Details
Closed on
Oct 27, 2009
Sold by
Morrill Douglas L and Morrill Roseanna
Bought by
Federal Home Loan Mortgage Corp
Create a Home Valuation Report for This Property
The Home Valuation Report is an in-depth analysis detailing your home's value as well as a comparison with similar homes in the area
Home Values in the Area
Average Home Value in this Area
Purchase History
| Date | Buyer | Sale Price | Title Company |
|---|---|---|---|
| Capoeman Joseph Charles | -- | Coast Title | |
| Federal Home Loan Mortgage Corp | $154,347 | Coast Title |
Source: Public Records
Mortgage History
| Date | Status | Borrower | Loan Amount |
|---|---|---|---|
| Open | Capoeman Joseph Charles | $207,668 |
Source: Public Records
Tax History Compared to Growth
Tax History
| Year | Tax Paid | Tax Assessment Tax Assessment Total Assessment is a certain percentage of the fair market value that is determined by local assessors to be the total taxable value of land and additions on the property. | Land | Improvement |
|---|---|---|---|---|
| 2025 | $4,030 | $420,714 | $46,640 | $374,074 |
| 2023 | $3,559 | $420,714 | $46,640 | $374,074 |
| 2022 | $4,174 | $358,171 | $43,200 | $314,971 |
| 2021 | $3,971 | $358,171 | $43,200 | $314,971 |
| 2020 | $3,839 | $309,368 | $40,000 | $269,368 |
| 2019 | $3,375 | $296,541 | $40,000 | $256,541 |
| 2018 | $3,888 | $274,282 | $40,000 | $234,282 |
| 2017 | $3,596 | $244,997 | $40,000 | $204,997 |
| 2016 | $3,154 | $235,235 | $40,000 | $195,235 |
| 2014 | -- | $218,200 | $40,000 | $178,200 |
| 2013 | -- | $232,030 | $40,000 | $192,030 |
Source: Public Records
Map
Nearby Homes