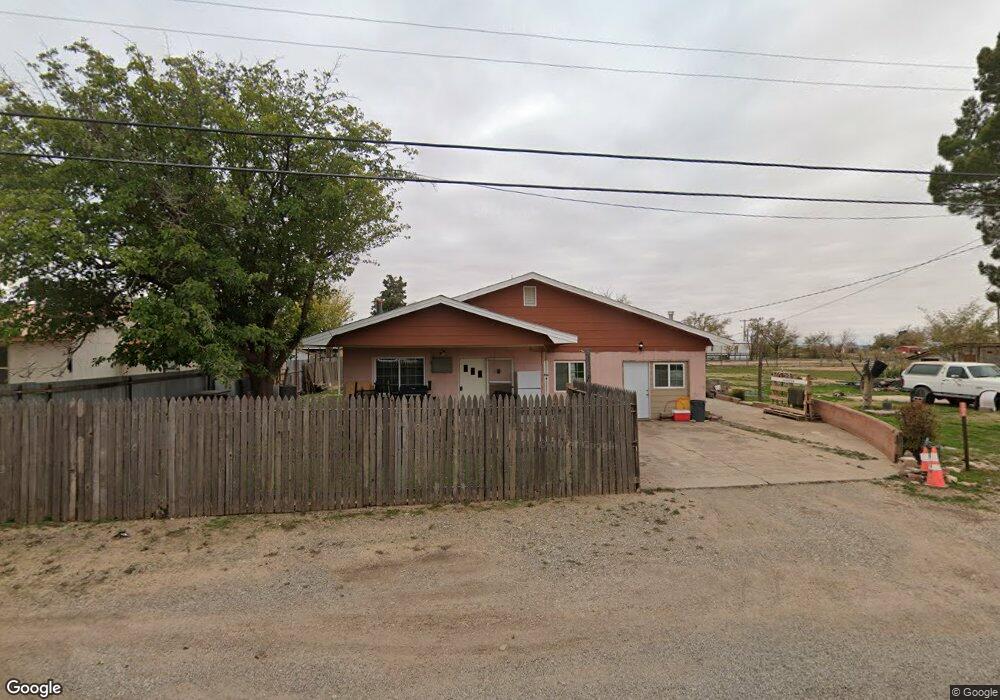
202 W Mountain View Rd Roswell, NM 88203
Estimated Value: $66,000 - $106,179
2
Beds
1
Bath
1,220
Sq Ft
$74/Sq Ft
Est. Value
About This Home
This home is located at 202 W Mountain View Rd, Roswell, NM 88203 and is currently estimated at $90,295, approximately $74 per square foot. 202 W Mountain View Rd is a home located in Chaves County with nearby schools including Sunset Elementary School, Mountain View Middle School, and Early College High School.
Ownership History
Date
Name
Owned For
Owner Type
Purchase Details
Closed on
Mar 30, 2023
Sold by
Garcia Maria D
Bought by
Garcia Maria D and Garcia Prisciliano F
Current Estimated Value
Purchase Details
Closed on
Jan 24, 2020
Sold by
Garcia Maria and Garcia Prisciliano
Bought by
Garcia Maria
Purchase Details
Closed on
Jan 23, 2020
Sold by
Wells Fargo Usa Holdings Inc
Bought by
Garcia Maria
Purchase Details
Closed on
Jun 20, 2019
Sold by
Doyle Robert
Bought by
Wells Fargo Usa Holdings Inc
Purchase Details
Closed on
Aug 12, 2005
Sold by
Sides Lee Bailey and Sides Lee
Bought by
Sides Sidney Frank and Sides Lee
Home Financials for this Owner
Home Financials are based on the most recent Mortgage that was taken out on this home.
Original Mortgage
$24,419
Interest Rate
10.97%
Mortgage Type
Adjustable Rate Mortgage/ARM
Create a Home Valuation Report for This Property
The Home Valuation Report is an in-depth analysis detailing your home's value as well as a comparison with similar homes in the area
Home Values in the Area
Average Home Value in this Area
Purchase History
| Date | Buyer | Sale Price | Title Company |
|---|---|---|---|
| Garcia Maria D | -- | -- | |
| Garcia Maria | -- | Landmark Title Roswell | |
| Garcia Maria | -- | Landmark Title Roswell | |
| Wells Fargo Usa Holdings Inc | -- | None Available | |
| Sides Sidney Frank | -- | None Available |
Source: Public Records
Mortgage History
| Date | Status | Borrower | Loan Amount |
|---|---|---|---|
| Previous Owner | Sides Sidney Frank | $24,419 |
Source: Public Records
Tax History Compared to Growth
Tax History
| Year | Tax Paid | Tax Assessment Tax Assessment Total Assessment is a certain percentage of the fair market value that is determined by local assessors to be the total taxable value of land and additions on the property. | Land | Improvement |
|---|---|---|---|---|
| 2025 | $443 | $21,155 | $752 | $20,403 |
| 2024 | $443 | $20,539 | $752 | $19,787 |
| 2023 | $442 | $19,941 | $752 | $19,189 |
| 2022 | $453 | $20,560 | $752 | $19,808 |
| 2021 | $441 | $19,961 | $752 | $19,209 |
| 2020 | $374 | $16,943 | $752 | $16,191 |
| 2019 | $229 | $12,029 | $752 | $11,277 |
| 2018 | $225 | $11,878 | $752 | $11,126 |
| 2017 | $239 | $12,578 | $752 | $11,826 |
| 2016 | $238 | $12,648 | $752 | $11,896 |
| 2015 | $280 | $13,238 | $752 | $12,486 |
| 2014 | $667 | $15,452 | $742 | $14,710 |
Source: Public Records
Map
Nearby Homes
- 5000 S Main St
- 3801 S Main St
- 500 W Brasher #78 Rd
- 00 Blanco Rosa Ln
- Buena Vida Block: 35 Lot: 1 Bk: 400
- 00 Hamill Rd St
- 5905 S Main St
- 8703 S Main St
- 2698 S Main St
- 702 Hickory Dr
- 100 Blk Jaffa St
- 5901 S Main St
- 5831 S Main St
- 2103 S Main St
- 2904 S Lea Ave
- 12 Murphy Place
- 2800 W Onyx St
- 2710 W Onyx St
- 2706 W Onyx St
- 2705 S Onyx Dr
- 202 W Mountain View Rd
- 200 W Mountain View Rd
- 201 W Mountain View Rd
- 4903 S Pennsylvania Ave
- 205 W Mountain View Rd
- 4906 S Main St
- 4908 S Main St
- 4909 S Pennsylvania Ave
- 4914 S Main St
- 4911 S Pennsylvania Ave
- 305 W Mountain View Rd
- 4607 S Pennsylvania Ave
- 4702 S Pennsylvania Ave
- 4600 S Main St
- 102 E Mountain View Rd
- 5003 S Pennsylvania Ave
- 4911 S Main St
- 403 W Mountain View Rd
- 5005 S Pennsylvania Ave
- 5007 S Pennsylvania Ave