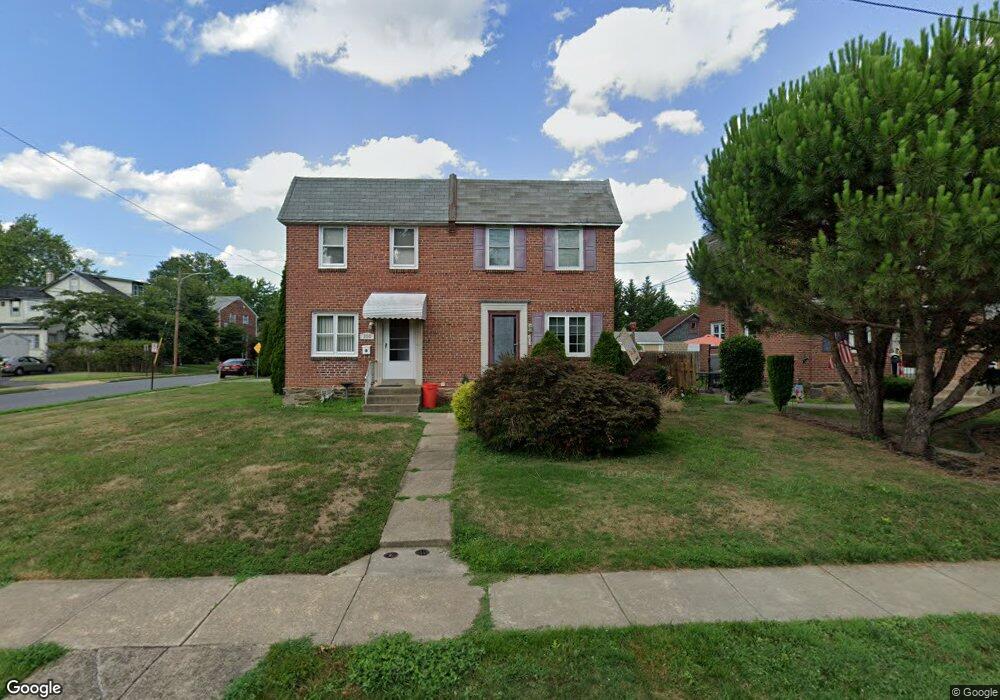
202 W Sylvan Ave Morton, PA 19070
Estimated Value: $239,721 - $292,000
2
Beds
1
Bath
918
Sq Ft
$288/Sq Ft
Est. Value
About This Home
This home is located at 202 W Sylvan Ave, Morton, PA 19070 and is currently estimated at $264,180, approximately $287 per square foot. 202 W Sylvan Ave is a home located in Delaware County with nearby schools including Springfield High School, St James Regional Catholic School, and Our Lady Of Fatima School.
Ownership History
Date
Name
Owned For
Owner Type
Purchase Details
Closed on
Sep 28, 2015
Sold by
Young Stephen J and Young Linda L
Bought by
Young Stephen J
Current Estimated Value
Purchase Details
Closed on
Jul 27, 2011
Sold by
Cicala Joseph M and Grant Sean
Bought by
Young Stephen J and Young Linda L
Purchase Details
Closed on
Mar 26, 2008
Sold by
Cicala Joseph M and Estate Of Suzanne M Cicala
Bought by
Cicala Joseph M and Grant Sean
Purchase Details
Closed on
Apr 30, 2004
Sold by
Chapis Nathan J and Wright Jamie
Bought by
Cicala Suzanne M
Purchase Details
Closed on
Jun 30, 1999
Sold by
Hoffman M Cynthia and Estate Of Dorothy A Stalker
Bought by
Chapis Nathan J and Wright Jamie
Home Financials for this Owner
Home Financials are based on the most recent Mortgage that was taken out on this home.
Original Mortgage
$64,800
Interest Rate
7.19%
Mortgage Type
FHA
Create a Home Valuation Report for This Property
The Home Valuation Report is an in-depth analysis detailing your home's value as well as a comparison with similar homes in the area
Home Values in the Area
Average Home Value in this Area
Purchase History
| Date | Buyer | Sale Price | Title Company |
|---|---|---|---|
| Young Stephen J | -- | Attorney | |
| Young Stephen J | $155,000 | None Available | |
| Cicala Joseph M | -- | None Available | |
| Cicala Suzanne M | $110,000 | -- | |
| Chapis Nathan J | $64,900 | -- |
Source: Public Records
Mortgage History
| Date | Status | Borrower | Loan Amount |
|---|---|---|---|
| Previous Owner | Chapis Nathan J | $64,800 |
Source: Public Records
Tax History Compared to Growth
Tax History
| Year | Tax Paid | Tax Assessment Tax Assessment Total Assessment is a certain percentage of the fair market value that is determined by local assessors to be the total taxable value of land and additions on the property. | Land | Improvement |
|---|---|---|---|---|
| 2025 | $3,949 | $126,610 | $30,380 | $96,230 |
| 2024 | $3,949 | $126,610 | $30,380 | $96,230 |
| 2023 | $2,967 | $126,610 | $30,380 | $96,230 |
| 2022 | $3,779 | $126,610 | $30,380 | $96,230 |
| 2021 | $5,609 | $126,610 | $30,380 | $96,230 |
| 2020 | $3,940 | $77,430 | $27,180 | $50,250 |
| 2019 | $3,864 | $77,430 | $27,180 | $50,250 |
| 2018 | $3,815 | $77,430 | $0 | $0 |
| 2017 | $3,744 | $77,430 | $0 | $0 |
| 2016 | $425 | $77,430 | $0 | $0 |
| 2015 | $434 | $77,430 | $0 | $0 |
| 2014 | $434 | $77,430 | $0 | $0 |
Source: Public Records
Map
Nearby Homes
- 226 W Sylvan Ave
- 120 Bridge St
- 1238 University Ave
- 2 Yale Ave
- 7 & 0 Woodland Ave
- 354 S Swarthmore Ave Unit B3
- 115 President Ave
- 1226 Redwood Ave
- 31 Silver Lake Terrace Unit 32
- 136 Linden Ave
- 246 Pennington Ave
- 945 Church Rd
- 216-218 President Ave
- 742 Agnes Ave
- 111 Broad St
- 15 Sycamore Ave
- 838 Springhaven Rd
- 345 Vassar Ave
- 937 Greenbriar Ln
- 912 Edgewood Ave
- 206 W Sylvan Ave
- 215 Bridge St
- 124 W Sylvan Ave
- 213 Bridge St
- 214 W Sylvan Ave
- 122 W Sylvan Ave
- 216 W Sylvan Ave
- 203 W Sylvan Ave
- 1 Beech St
- 207 W Sylvan Ave
- 127 W Sylvan Ave
- 2 Beech St
- 118 W Sylvan Ave
- 3 Beech St
- 218 W Sylvan Ave
- 211 Bridge St
- 211 W Sylvan Ave
- 201 Beech St
- 4 Beech St
- 123 W Sylvan Ave