Estimated Value: $790,000 - $862,000
3
Beds
3
Baths
1,634
Sq Ft
$506/Sq Ft
Est. Value
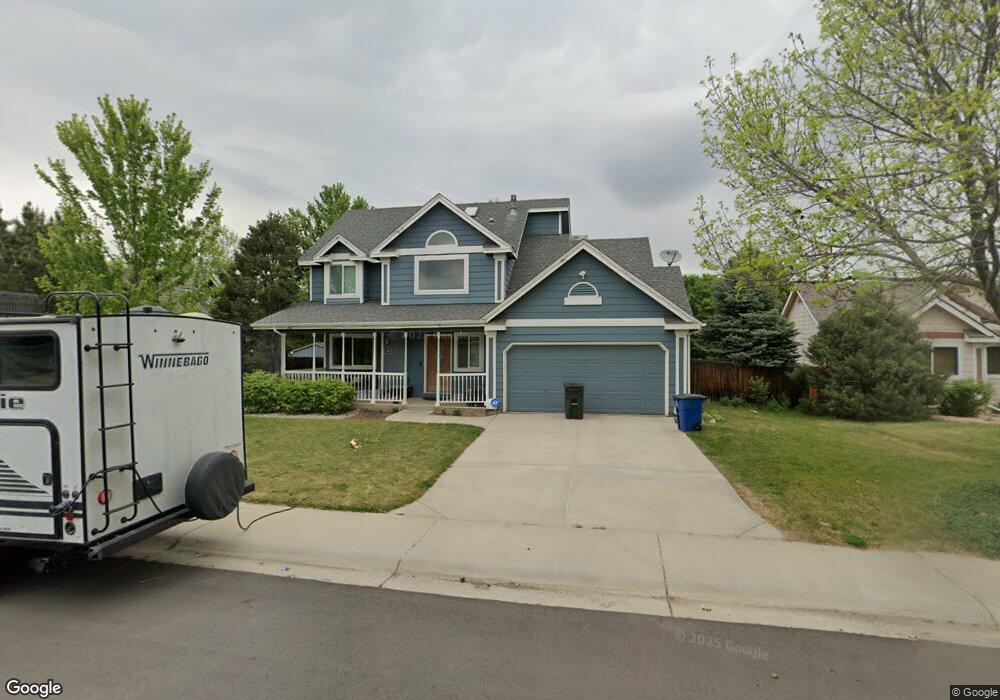
About This Home
This home is located at 202 Welch Ct, Lyons, CO 80540 and is currently estimated at $827,385, approximately $506 per square foot. 202 Welch Ct is a home located in Boulder County with nearby schools including Lyons Elementary School and Lyons Middle/Senior High School.
Ownership History
Date
Name
Owned For
Owner Type
Purchase Details
Closed on
Feb 19, 2010
Sold by
Reed Troy E and Reed Amy K
Bought by
Sharman George F
Current Estimated Value
Home Financials for this Owner
Home Financials are based on the most recent Mortgage that was taken out on this home.
Original Mortgage
$100,000
Outstanding Balance
$66,249
Interest Rate
5.05%
Mortgage Type
New Conventional
Estimated Equity
$761,136
Purchase Details
Closed on
Apr 27, 2009
Sold by
Kramer Thomas S and Kramer Michelle L
Bought by
Reed Troy E
Home Financials for this Owner
Home Financials are based on the most recent Mortgage that was taken out on this home.
Original Mortgage
$324,022
Interest Rate
5.03%
Mortgage Type
FHA
Purchase Details
Closed on
May 24, 1993
Bought by
Sharman George F and Faike Robyn
Purchase Details
Closed on
May 19, 1993
Bought by
Sharman George F and Faike Robyn
Create a Home Valuation Report for This Property
The Home Valuation Report is an in-depth analysis detailing your home's value as well as a comparison with similar homes in the area
Purchase History
| Date | Buyer | Sale Price | Title Company |
|---|---|---|---|
| Sharman George F | $340,000 | None Available | |
| Reed Troy E | $330,000 | Utc Colorado | |
| Sharman George F | $22,000 | -- | |
| Sharman George F | -- | -- |
Source: Public Records
Mortgage History
| Date | Status | Borrower | Loan Amount |
|---|---|---|---|
| Open | Sharman George F | $100,000 | |
| Previous Owner | Reed Troy E | $324,022 |
Source: Public Records
Tax History
| Year | Tax Paid | Tax Assessment Tax Assessment Total Assessment is a certain percentage of the fair market value that is determined by local assessors to be the total taxable value of land and additions on the property. | Land | Improvement |
|---|---|---|---|---|
| 2025 | $6,166 | $49,544 | $4,619 | $44,925 |
| 2024 | $6,166 | $49,544 | $4,619 | $44,925 |
| 2023 | $6,082 | $51,845 | $4,288 | $51,242 |
| 2022 | $4,915 | $39,865 | $3,927 | $35,938 |
| 2021 | $4,856 | $41,013 | $4,040 | $36,973 |
| 2020 | $4,619 | $38,653 | $10,296 | $28,357 |
| 2019 | $4,527 | $38,653 | $10,296 | $28,357 |
| 2018 | $3,890 | $33,883 | $10,368 | $23,515 |
| 2017 | $3,826 | $37,459 | $11,462 | $25,997 |
| 2016 | $3,840 | $31,800 | $9,950 | $21,850 |
| 2015 | $3,507 | $26,650 | $3,980 | $22,670 |
| 2014 | $2,763 | $26,650 | $3,980 | $22,670 |
Source: Public Records
Map
Nearby Homes
- 104 Noland Ct
- 350 Mcconnell Dr
- 430 Carter Dr
- 342 4th Ave
- 121 Osprey Ln
- 618 Overlook Dr
- 18673 Route 7
- 622 3rd Ave
- 125 Longs Peak Dr
- 223 Stone Canyon Rd
- 1040 5th Ave 2 and 4
- 1040 5th Ave 5
- 0 Apple Valley Rd
- 1117 5th Ave
- 1117 N 5th Ave
- 119 Eagle Canyon Cir
- 2615 Eagle Ridge Rd
- 2685 Eagle Ridge Rd
- 1285 Eagle Ridge Rd
- 11730 Pointe View Dr
Your Personal Tour Guide
Ask me questions while you tour the home.