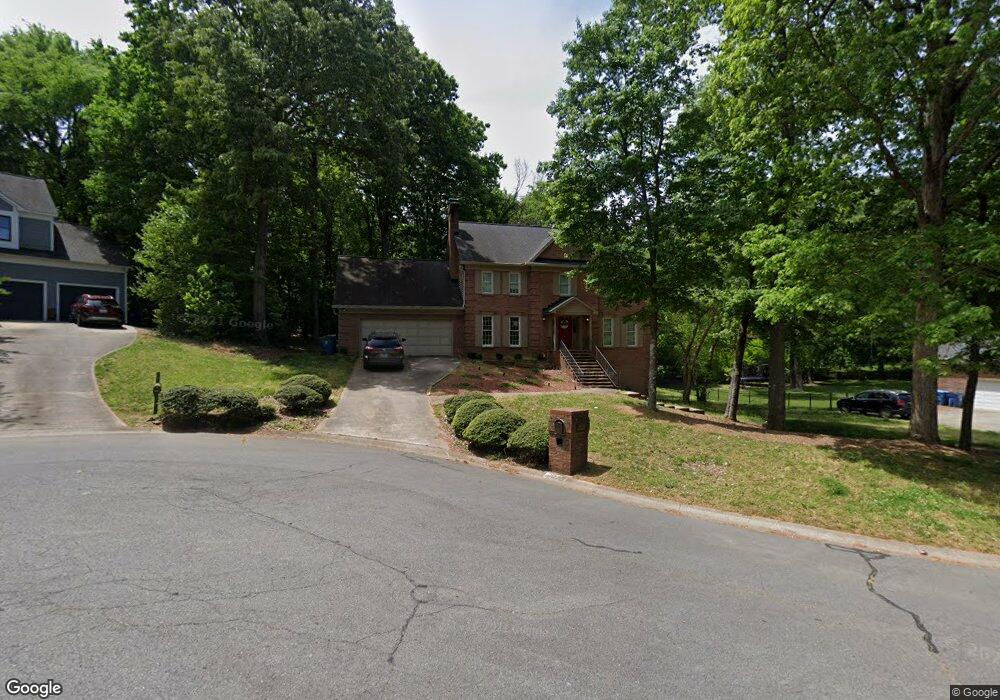
2020 Fairchelsea Way Ln Unit 8 Matthews, NC 28105
Estimated Value: $632,000 - $757,425
4
Beds
3
Baths
3,626
Sq Ft
$189/Sq Ft
Est. Value
About This Home
This home is located at 2020 Fairchelsea Way Ln Unit 8, Matthews, NC 28105 and is currently estimated at $686,106, approximately $189 per square foot. 2020 Fairchelsea Way Ln Unit 8 is a home located in Mecklenburg County with nearby schools including Matthews Elementary, Crestdale Middle School, and Butler High School.
Ownership History
Date
Name
Owned For
Owner Type
Purchase Details
Closed on
Dec 7, 2022
Sold by
Mecklenburg Investment Group Llc
Bought by
Pham Hank and Nguyen Thanh
Current Estimated Value
Home Financials for this Owner
Home Financials are based on the most recent Mortgage that was taken out on this home.
Original Mortgage
$513,000
Outstanding Balance
$497,969
Interest Rate
7.08%
Mortgage Type
Balloon
Estimated Equity
$188,137
Purchase Details
Closed on
Jun 30, 2022
Sold by
Brett Pierce Eric and Brett Graham
Bought by
Mecklenburg Investment Group Llc
Purchase Details
Closed on
Jul 15, 2016
Sold by
Fileds William F and Fileds Judith A
Bought by
Pierce Eric Brett and Pierce Fraham
Home Financials for this Owner
Home Financials are based on the most recent Mortgage that was taken out on this home.
Original Mortgage
$285,510
Interest Rate
3.66%
Mortgage Type
FHA
Purchase Details
Closed on
Jun 30, 1987
Bought by
Fields William F and Fields Judith A
Create a Home Valuation Report for This Property
The Home Valuation Report is an in-depth analysis detailing your home's value as well as a comparison with similar homes in the area
Home Values in the Area
Average Home Value in this Area
Purchase History
| Date | Buyer | Sale Price | Title Company |
|---|---|---|---|
| Pham Hank | $570,000 | -- | |
| Mecklenburg Investment Group Llc | $385,000 | Lancaster Trotter & Poe Pllc | |
| Pierce Eric Brett | $295,000 | Integrated Title Ins Se | |
| Fields William F | $156,500 | -- |
Source: Public Records
Mortgage History
| Date | Status | Borrower | Loan Amount |
|---|---|---|---|
| Open | Pham Hank | $513,000 | |
| Previous Owner | Pierce Eric Brett | $285,510 |
Source: Public Records
Tax History Compared to Growth
Tax History
| Year | Tax Paid | Tax Assessment Tax Assessment Total Assessment is a certain percentage of the fair market value that is determined by local assessors to be the total taxable value of land and additions on the property. | Land | Improvement |
|---|---|---|---|---|
| 2025 | $4,122 | $543,300 | $105,000 | $438,300 |
| 2024 | $4,122 | $543,300 | $105,000 | $438,300 |
| 2023 | $4,122 | $543,300 | $105,000 | $438,300 |
| 2022 | $3,008 | $325,500 | $80,000 | $245,500 |
| 2021 | $3,008 | $325,500 | $80,000 | $245,500 |
| 2020 | $2,959 | $325,500 | $80,000 | $245,500 |
| 2019 | $2,953 | $325,500 | $80,000 | $245,500 |
| 2018 | $3,039 | $255,600 | $50,000 | $205,600 |
| 2017 | $2,978 | $255,600 | $50,000 | $205,600 |
| 2016 | $2,682 | $230,300 | $50,000 | $180,300 |
| 2015 | $2,679 | $230,300 | $50,000 | $180,300 |
| 2014 | $2,729 | $239,500 | $50,000 | $189,500 |
Source: Public Records
Map
Nearby Homes
- 2017 Shannon Bridge Ln
- 2304 Wineberry Ct
- 2621 Brightmoor Ridge Dr
- 1840 Thornblade Ridge Dr
- 2650 Whisper Ridge Ln
- 1308 Pleasant Plains Rd
- 1304 Pleasant Plains Rd
- 2729 Edgebrook Cir
- 2424 Honey Creek Ln
- 2423 Winterbrooke Dr
- 302 Wilcrest Dr
- 1206 Matthews Plantation Dr
- 6932 Augustine Way
- 2413 Cross Country Rd
- 425 Gilchrest Cir
- 1401 Matthews Plantation Dr
- 1016 Talbot Ct
- 2700 Cross Country Rd
- 209 Whitefriars Ln
- 2107 N Castle Ct
- 2020 Fairchelsea Way Ln
- 2024 Fairchelsea Way Ln
- 2010 Fairchelsea Way Ln
- 2021 Shannon Bridge Ln
- 2028 Fairchelsea Way Ln
- 2028 Fairchelsea Way Ln Unit 6
- 2011 Shannon Bridge Ln
- 2017 Fairchelsea Way Ln
- 2023 Fairchelsea Way Ln
- 2027 Fairchelsea Way Ln
- 2025 Shannon Bridge Ln
- 2009 Fairchelsea Way Ln
- 1437 Ashley Creek Dr
- 1445 Ashley Creek Dr
- 2001 Fairchelsea Way Ln
- 2024 Shannon Bridge Ln
- 2018 Kilkenney Hill Rd
- 2024 Kilkenney Hill Rd
- 2020 Shannon Bridge Ln
- 2010 Kilkenney Hill Rd