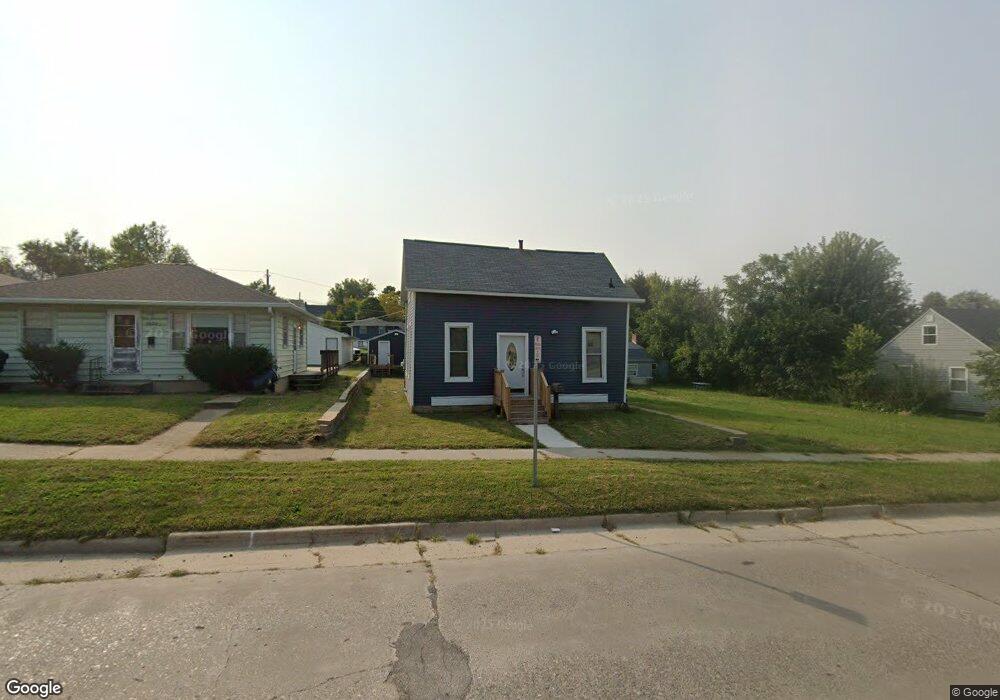
2020 J St SW Cedar Rapids, IA 52404
Southwest Area NeighborhoodEstimated Value: $74,000 - $132,000
2
Beds
2
Baths
813
Sq Ft
$128/Sq Ft
Est. Value
About This Home
This home is located at 2020 J St SW, Cedar Rapids, IA 52404 and is currently estimated at $104,085, approximately $128 per square foot. 2020 J St SW is a home located in Linn County with nearby schools including Junction City Elementary School, Grant Elementary School, and Bruce Hall Day Treatment Center.
Ownership History
Date
Name
Owned For
Owner Type
Purchase Details
Closed on
Sep 28, 2021
Sold by
Armstrong Neil
Bought by
Johnston James T
Current Estimated Value
Home Financials for this Owner
Home Financials are based on the most recent Mortgage that was taken out on this home.
Original Mortgage
$45,000
Outstanding Balance
$41,036
Interest Rate
2.8%
Mortgage Type
Purchase Money Mortgage
Estimated Equity
$63,049
Purchase Details
Closed on
Dec 9, 2020
Sold by
Rudkin Brandon
Bought by
Armstrong Neil
Home Financials for this Owner
Home Financials are based on the most recent Mortgage that was taken out on this home.
Original Mortgage
$33,300
Interest Rate
8%
Mortgage Type
Land Contract Argmt. Of Sale
Purchase Details
Closed on
Sep 1, 2020
Sold by
Shock John R
Bought by
Pg Home Buyers Llc
Create a Home Valuation Report for This Property
The Home Valuation Report is an in-depth analysis detailing your home's value as well as a comparison with similar homes in the area
Home Values in the Area
Average Home Value in this Area
Purchase History
| Date | Buyer | Sale Price | Title Company |
|---|---|---|---|
| Johnston James T | $48,000 | None Available | |
| Armstrong Neil | $37,000 | None Available | |
| Pg Home Buyers Llc | $12,000 | None Available |
Source: Public Records
Mortgage History
| Date | Status | Borrower | Loan Amount |
|---|---|---|---|
| Open | Johnston James T | $45,000 | |
| Closed | Armstrong Neil | $33,300 |
Source: Public Records
Tax History Compared to Growth
Tax History
| Year | Tax Paid | Tax Assessment Tax Assessment Total Assessment is a certain percentage of the fair market value that is determined by local assessors to be the total taxable value of land and additions on the property. | Land | Improvement |
|---|---|---|---|---|
| 2025 | $736 | $93,100 | $27,500 | $65,600 |
| 2024 | $124 | $54,700 | $22,400 | $32,300 |
| 2023 | $124 | $52,000 | $20,400 | $31,600 |
| 2022 | $259 | $46,200 | $20,400 | $25,800 |
| 2021 | $1,114 | $62,700 | $20,400 | $42,300 |
| 2020 | $1,114 | $59,100 | $20,400 | $38,700 |
| 2019 | $898 | $56,400 | $17,300 | $39,100 |
| 2018 | $870 | $50,200 | $17,300 | $32,900 |
| 2017 | $966 | $52,900 | $17,300 | $35,600 |
| 2016 | $1,141 | $53,700 | $17,300 | $36,400 |
| 2015 | $1,187 | $55,818 | $17,340 | $38,478 |
| 2014 | $1,002 | $57,008 | $17,340 | $39,668 |
| 2013 | $1,002 | $57,008 | $17,340 | $39,668 |
Source: Public Records
Map
Nearby Homes
- 1804 I St SW
- 186 22nd Ave SW
- 2021 Hamilton St SW
- 192 15th Ave SW
- 2536 L St SW
- 280 14th Ave SW
- 2417 Illinois St SW
- 1756 Mallory St SW
- 1411 1st St SW
- 1435 N St SW
- 2511 Indiana St SW
- 1323 M St SW
- 1426 N St SW
- 69 26th Ave SW
- 1300 M St SW
- 648 22nd Ave SW
- 657 16th Ave SW
- 826 21st Ave SW
- 401 28th Ave SW
- 90 29th Ave SW