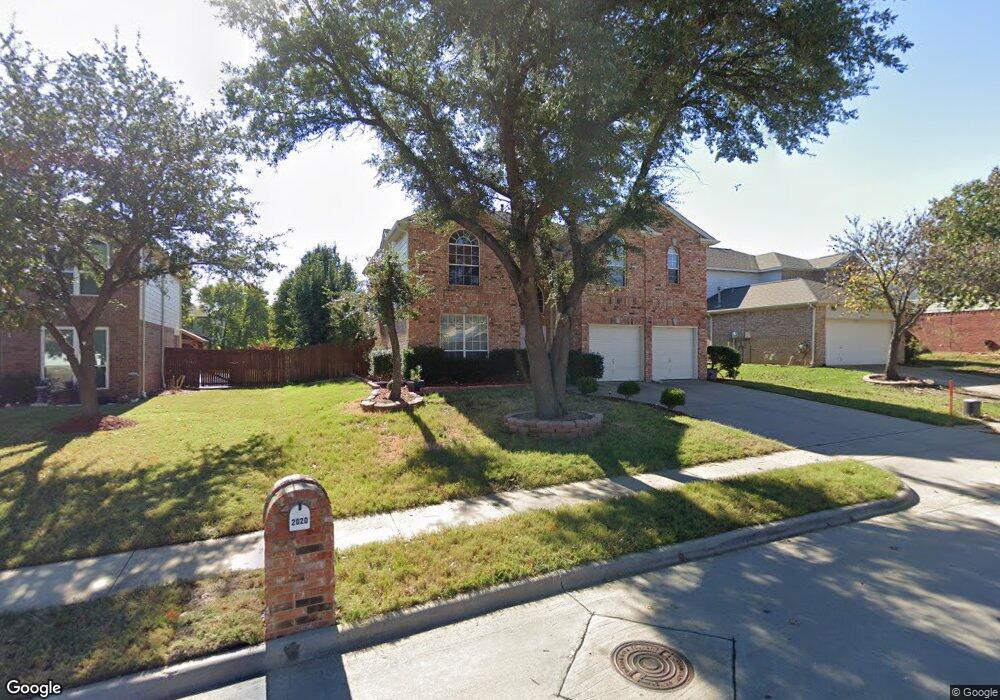
2020 Lamprey Cir Denton, TX 76210
South Denton NeighborhoodEstimated Value: $408,771 - $459,000
3
Beds
2
Baths
2,635
Sq Ft
$163/Sq Ft
Est. Value
About This Home
This home is located at 2020 Lamprey Cir, Denton, TX 76210 and is currently estimated at $430,193, approximately $163 per square foot. 2020 Lamprey Cir is a home located in Denton County with nearby schools including Houston Elementary School, McMath Middle School, and Denton High School.
Ownership History
Date
Name
Owned For
Owner Type
Purchase Details
Closed on
Jul 10, 2003
Sold by
Fannie Mae
Bought by
Borda Juan Carlos and Mojica Zulma
Current Estimated Value
Home Financials for this Owner
Home Financials are based on the most recent Mortgage that was taken out on this home.
Original Mortgage
$145,713
Interest Rate
5.24%
Mortgage Type
FHA
Purchase Details
Closed on
Feb 4, 2003
Sold by
Catlin Cedric Wayne
Bought by
Federal National Mortgage Association
Purchase Details
Closed on
Dec 11, 1998
Sold by
Pulte Homes Of Texas Lp
Bought by
Catlin Cedric Wayne
Home Financials for this Owner
Home Financials are based on the most recent Mortgage that was taken out on this home.
Original Mortgage
$141,569
Interest Rate
6.87%
Create a Home Valuation Report for This Property
The Home Valuation Report is an in-depth analysis detailing your home's value as well as a comparison with similar homes in the area
Home Values in the Area
Average Home Value in this Area
Purchase History
| Date | Buyer | Sale Price | Title Company |
|---|---|---|---|
| Borda Juan Carlos | -- | -- | |
| Borda Juan Carlos | -- | -- | |
| Federal National Mortgage Association | $144,945 | -- | |
| Federal National Mortgage Association | $144,945 | -- | |
| Catlin Cedric Wayne | -- | -- |
Source: Public Records
Mortgage History
| Date | Status | Borrower | Loan Amount |
|---|---|---|---|
| Closed | Borda Juan Carlos | $145,713 | |
| Previous Owner | Catlin Cedric Wayne | $141,569 |
Source: Public Records
Tax History Compared to Growth
Tax History
| Year | Tax Paid | Tax Assessment Tax Assessment Total Assessment is a certain percentage of the fair market value that is determined by local assessors to be the total taxable value of land and additions on the property. | Land | Improvement |
|---|---|---|---|---|
| 2025 | $6,279 | $411,359 | $72,921 | $338,438 |
| 2024 | $7,474 | $387,224 | $0 | $0 |
| 2023 | $5,525 | $352,022 | $72,921 | $345,773 |
| 2022 | $6,793 | $320,020 | $72,921 | $283,881 |
| 2021 | $6,467 | $290,927 | $57,069 | $233,858 |
| 2020 | $6,251 | $273,458 | $57,069 | $216,389 |
| 2019 | $6,368 | $266,902 | $57,069 | $209,833 |
| 2018 | $6,180 | $255,823 | $57,069 | $198,754 |
| 2017 | $5,787 | $234,107 | $57,069 | $177,038 |
| 2016 | $5,238 | $215,661 | $38,046 | $183,690 |
| 2015 | $4,388 | $196,055 | $38,046 | $158,009 |
| 2013 | -- | $174,825 | $38,046 | $136,779 |
Source: Public Records
Map
Nearby Homes
- 2000 Lamprey Cir
- 2209 Loon Lake Rd
- 2009 Lake Fork Ct
- 2312 Caddo Cir
- 3432 Sundown Blvd
- 2409 Loon Lake Rd
- 2505 Pioneer Dr
- 2508 Pioneer Dr
- 720 Smokerise Cir
- 1108 Ellison Park Cir
- 2600 Pioneer Dr
- 2501 Great Bear Ln
- 916 Smokerise Cir
- 1012 Indian Ridge Dr
- 2601 Pinto Dr
- 2544 Natchez Trace
- 2008 Moonsail Ln
- 2272 Hollyhill Ln
- 2713 Clubhouse Dr
- 2253 Hollyhill Ln
- 2016 Lamprey Cir
- 2100 Lamprey Cir
- 2012 Lamprey Cir
- 2104 Lamprey Cir
- 2021 Loon Lake Rd
- 2017 Loon Lake Rd
- 2101 Loon Lake Rd
- 2013 Loon Lake Rd
- 2021 Lamprey Cir
- 2017 Lamprey Cir
- 2008 Lamprey Cir
- 2105 Loon Lake Rd
- 2101 Lamprey Cir
- 2009 Loon Lake Rd
- 2013 Lamprey Cir
- 3212 Saint Claire Dr
- 3216 Saint Claire Dr
- 2105 Lamprey Cir
- 3220 Saint Claire Dr
- 2005 Loon Lake Rd