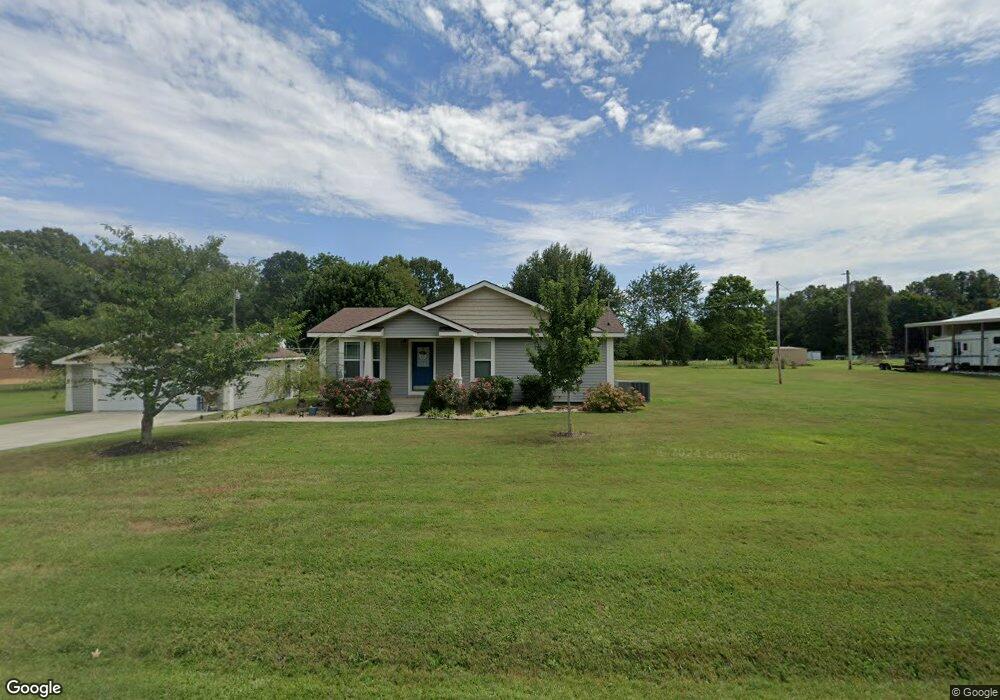
2020 Mason Lake Rd Puryear, TN 38251
Estimated Value: $165,000 - $254,000
--
Bed
1
Bath
1,556
Sq Ft
$135/Sq Ft
Est. Value
About This Home
This home is located at 2020 Mason Lake Rd, Puryear, TN 38251 and is currently estimated at $210,447, approximately $135 per square foot. 2020 Mason Lake Rd is a home located in Henry County.
Ownership History
Date
Name
Owned For
Owner Type
Purchase Details
Closed on
Sep 6, 2013
Sold by
Smith Curtis L
Bought by
Adams Megan N and Adams Scott E
Current Estimated Value
Home Financials for this Owner
Home Financials are based on the most recent Mortgage that was taken out on this home.
Original Mortgage
$128,061
Outstanding Balance
$95,525
Interest Rate
4.39%
Mortgage Type
Cash
Estimated Equity
$114,922
Purchase Details
Closed on
Oct 27, 2010
Sold by
The Murray Bank
Bought by
Smith Curtis
Home Financials for this Owner
Home Financials are based on the most recent Mortgage that was taken out on this home.
Original Mortgage
$60,000
Interest Rate
4.37%
Mortgage Type
Cash
Purchase Details
Closed on
Apr 27, 2009
Bought by
Murray Bank
Purchase Details
Closed on
Nov 18, 2004
Sold by
And Holton Michael
Bought by
Allen Henson
Purchase Details
Closed on
Feb 16, 2000
Sold by
Overcast Stanley B
Bought by
Dees Bank Of Hazel
Purchase Details
Closed on
Feb 10, 1999
Sold by
Overcast Stanley B
Bought by
Overcast Bonnie J
Purchase Details
Closed on
Sep 8, 1976
Bought by
Littleton Mary
Create a Home Valuation Report for This Property
The Home Valuation Report is an in-depth analysis detailing your home's value as well as a comparison with similar homes in the area
Home Values in the Area
Average Home Value in this Area
Purchase History
| Date | Buyer | Sale Price | Title Company |
|---|---|---|---|
| Adams Megan N | $125,500 | -- | |
| Smith Curtis | $35,000 | -- | |
| Murray Bank | $45,300 | -- | |
| Allen Henson | $40,000 | -- | |
| Dees Bank Of Hazel | $21,000 | -- | |
| Overcast Bonnie J | -- | -- | |
| Littleton Mary | -- | -- |
Source: Public Records
Mortgage History
| Date | Status | Borrower | Loan Amount |
|---|---|---|---|
| Open | Adams Megan N | $128,061 | |
| Previous Owner | Littleton Mary | $60,000 |
Source: Public Records
Tax History Compared to Growth
Tax History
| Year | Tax Paid | Tax Assessment Tax Assessment Total Assessment is a certain percentage of the fair market value that is determined by local assessors to be the total taxable value of land and additions on the property. | Land | Improvement |
|---|---|---|---|---|
| 2024 | $534 | $27,625 | $1,975 | $25,650 |
| 2023 | $523 | $27,625 | $1,975 | $25,650 |
| 2022 | $523 | $27,625 | $1,975 | $25,650 |
| 2021 | $523 | $27,625 | $1,975 | $25,650 |
| 2020 | $523 | $27,625 | $1,975 | $25,650 |
| 2019 | $526 | $25,150 | $1,775 | $23,375 |
| 2018 | $526 | $25,150 | $1,775 | $23,375 |
| 2017 | $526 | $25,150 | $1,775 | $23,375 |
| 2016 | $519 | $25,150 | $1,775 | $23,375 |
| 2015 | $553 | $25,150 | $1,775 | $23,375 |
| 2014 | $505 | $25,150 | $1,775 | $23,375 |
| 2013 | $505 | $22,979 | $0 | $0 |
Source: Public Records
Map
Nearby Homes
- 0 Highway 641 N Unit 133861
- 13570 Highway 641 N
- 0 State Line Rd E
- 000 State Line Rd E
- 505 5th St
- 00 Atkins Trail
- 820 3rd St
- 000 Perkins Rd
- 0 Perkins Rd
- 00 Perkins Rd
- 1230 Perkins Rd
- 200 Morris Rd
- 317 Stokes St
- 236 W Chestnut St
- 9620 Hwy 641n
- 0 Highway 140 E
- 2794 Perkins Rd
- 10433 Shady Grove Rd
- 715 Shoemaker Rd
- 00 641 S
- 2010 Mason Lake Rd
- 2050 Mason Lake Rd
- 1950 Mason Lake Rd
- 1850 Mason Lake Rd
- 13740 Us Hwy 641
- 13740 Highway 641 N
- 13740 Highway 641 N
- 1810 Mason Lake Rd
- 13630 Highway 641 N
- 13650 Highway 641 N
- 129 State St
- 125 State St
- 201 State St
- 13600 Highway 641 N
- 121 State St
- 13800 Highway 641 N
- 203 State St
- 209 State St Unit Hwy 641 South
- 209 State St
- 13625 Highway 641 N