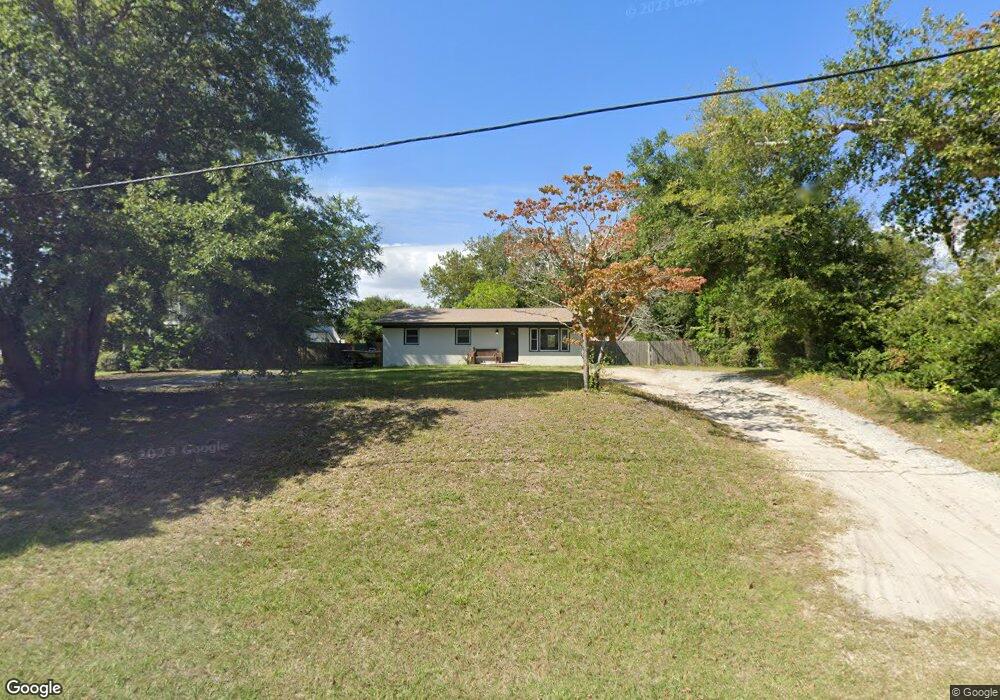
2020 Middle Sound Loop Rd Wilmington, NC 28411
Estimated Value: $378,467 - $474,000
3
Beds
2
Baths
1,189
Sq Ft
$350/Sq Ft
Est. Value
About This Home
This home is located at 2020 Middle Sound Loop Rd, Wilmington, NC 28411 and is currently estimated at $416,117, approximately $349 per square foot. 2020 Middle Sound Loop Rd is a home located in New Hanover County with nearby schools including Ogden Elementary School, M.C.S. Noble Middle School, and Emsley A. Laney High School.
Ownership History
Date
Name
Owned For
Owner Type
Purchase Details
Closed on
Nov 25, 2014
Sold by
Rydzewski Eric James
Bought by
Benefield Brian David
Current Estimated Value
Home Financials for this Owner
Home Financials are based on the most recent Mortgage that was taken out on this home.
Original Mortgage
$155,000
Outstanding Balance
$86,979
Interest Rate
4.16%
Mortgage Type
Purchase Money Mortgage
Estimated Equity
$329,138
Purchase Details
Closed on
Jan 30, 1998
Sold by
Polla Ugo Louis
Bought by
Rydzewski Eric James
Purchase Details
Closed on
Jul 3, 1990
Sold by
Williams Charles F Judy M
Bought by
Polla Ugo Louis
Purchase Details
Closed on
Sep 1, 1981
Sold by
Blake Eustice G
Bought by
Williams Charles F Judy M
Purchase Details
Closed on
Jan 1, 1975
Bought by
Blake Eustice G
Create a Home Valuation Report for This Property
The Home Valuation Report is an in-depth analysis detailing your home's value as well as a comparison with similar homes in the area
Home Values in the Area
Average Home Value in this Area
Purchase History
| Date | Buyer | Sale Price | Title Company |
|---|---|---|---|
| Benefield Brian David | $165,000 | None Available | |
| Rydzewski Eric James | $105,000 | -- | |
| Polla Ugo Louis | $65,500 | -- | |
| Williams Charles F Judy M | $38,000 | -- | |
| Blake Eustice G | $8,000 | -- |
Source: Public Records
Mortgage History
| Date | Status | Borrower | Loan Amount |
|---|---|---|---|
| Open | Benefield Brian David | $155,000 |
Source: Public Records
Tax History Compared to Growth
Tax History
| Year | Tax Paid | Tax Assessment Tax Assessment Total Assessment is a certain percentage of the fair market value that is determined by local assessors to be the total taxable value of land and additions on the property. | Land | Improvement |
|---|---|---|---|---|
| 2025 | $1,196 | $444,700 | $258,900 | $185,800 |
| 2023 | $1,196 | $214,800 | $128,200 | $86,600 |
| 2022 | $1,201 | $214,800 | $128,200 | $86,600 |
| 2021 | $1,188 | $214,800 | $128,200 | $86,600 |
| 2020 | $958 | $151,500 | $57,400 | $94,100 |
| 2019 | $958 | $151,500 | $57,400 | $94,100 |
| 2018 | $958 | $151,500 | $57,400 | $94,100 |
| 2017 | $981 | $151,500 | $57,400 | $94,100 |
| 2016 | $916 | $132,200 | $58,500 | $73,700 |
| 2015 | $851 | $132,200 | $58,500 | $73,700 |
| 2014 | $837 | $132,200 | $58,500 | $73,700 |
Source: Public Records
Map
Nearby Homes
- 2032 Middle Sound Loop Rd
- 2038 Trinity Ave
- 1108 Baldwin Park Dr
- 1911 Middle Sound Loop Rd
- 1901 Middle Sound Loop Rd
- 1835 Middle Sound Loop Rd
- 7301 Shell Midden Ct
- 1933 Loblolly Landing Ln
- 1001 Anchors Bend Way
- 1956 Deep Creek Run
- 935 Baldwin Park Dr
- 1120 Harborside Ct
- 7003 Northbend Rd
- 113 Long John Silver Dr
- 1501 Field View Rd
- 904 Anchors Bend Way
- 116 Stonehead Ct
- 835 Anchors Bend Way Unit 24
- Tilley Plan at Anchors Bend Townes
- Montague Plan at Anchors Bend Townes
- 2024 Middle Sound Loop Rd
- 2016 Middle Sound Loop Rd
- 1920 Hess Rd
- 1916 Hess St
- 1925 Bailey Ave
- 2017 Middle Sound Loop Rd
- 2012 Middle Sound Loop Rd
- 2015 Middle Sound Loop Rd
- 1921 Hess St
- 2009 Middle Sound Loop Rd
- 1912 Hess Rd
- 1921 Hess Rd
- 2008 Middle Sound Loop Rd
- 1917 Bailey Ave
- 1917 Hess St
- 2014 Trinity Ave
- 1917 Hess Rd
- 2005 Middle Sound Loop Rd
- 1908 Hess Rd
- 2102 Middle Sound Loop Rd