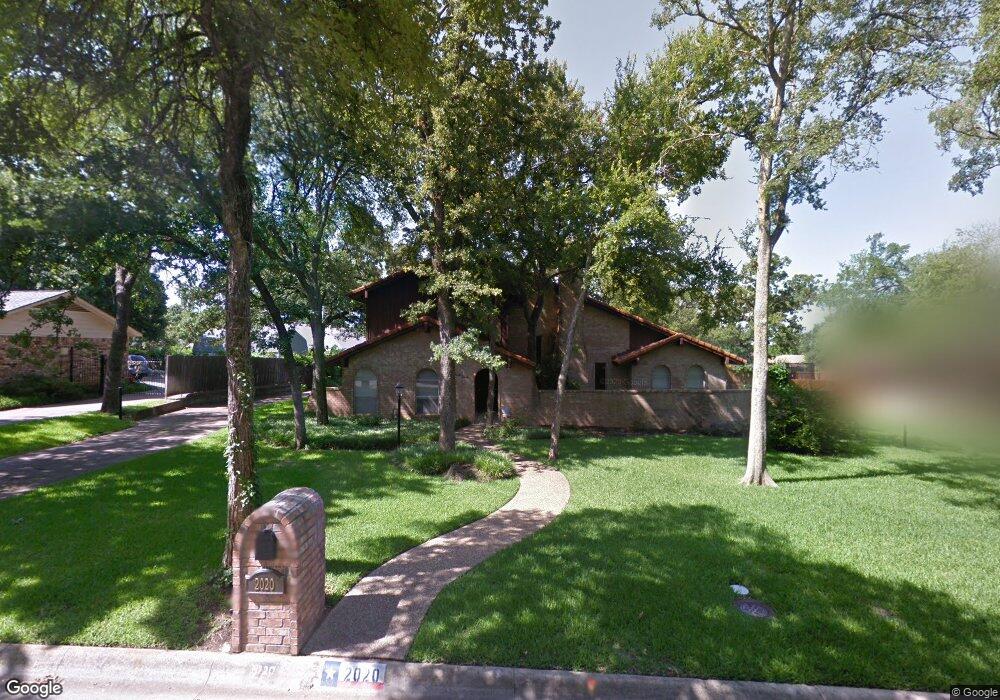
2020 Pembrooke Place Denton, TX 76205
South Denton NeighborhoodEstimated Value: $440,540 - $481,000
3
Beds
3
Baths
2,632
Sq Ft
$178/Sq Ft
Est. Value
About This Home
This home is located at 2020 Pembrooke Place, Denton, TX 76205 and is currently estimated at $469,135, approximately $178 per square foot. 2020 Pembrooke Place is a home located in Denton County with nearby schools including Houston Elementary School, McMath Middle School, and Denton High School.
Ownership History
Date
Name
Owned For
Owner Type
Purchase Details
Closed on
Sep 28, 2001
Sold by
Woolridge Donald Weldon
Bought by
Griner Burton D and Griner Patsy A
Current Estimated Value
Home Financials for this Owner
Home Financials are based on the most recent Mortgage that was taken out on this home.
Original Mortgage
$141,850
Interest Rate
6.88%
Purchase Details
Closed on
Nov 13, 2000
Sold by
White Anne Marie
Bought by
White Donald Ray
Home Financials for this Owner
Home Financials are based on the most recent Mortgage that was taken out on this home.
Original Mortgage
$141,850
Interest Rate
7.9%
Mortgage Type
Seller Take Back
Purchase Details
Closed on
May 28, 1998
Sold by
Kreps Betty
Bought by
White Donald R and White Anne
Home Financials for this Owner
Home Financials are based on the most recent Mortgage that was taken out on this home.
Original Mortgage
$141,850
Interest Rate
7.22%
Create a Home Valuation Report for This Property
The Home Valuation Report is an in-depth analysis detailing your home's value as well as a comparison with similar homes in the area
Home Values in the Area
Average Home Value in this Area
Purchase History
| Date | Buyer | Sale Price | Title Company |
|---|---|---|---|
| Griner Burton D | -- | -- | |
| White Donald Ray | -- | -- | |
| White Donald R | -- | -- |
Source: Public Records
Mortgage History
| Date | Status | Borrower | Loan Amount |
|---|---|---|---|
| Closed | Griner Burton D | $141,850 | |
| Previous Owner | White Donald Ray | $141,850 | |
| Previous Owner | White Donald R | $141,850 |
Source: Public Records
Tax History Compared to Growth
Tax History
| Year | Tax Paid | Tax Assessment Tax Assessment Total Assessment is a certain percentage of the fair market value that is determined by local assessors to be the total taxable value of land and additions on the property. | Land | Improvement |
|---|---|---|---|---|
| 2025 | $5,000 | $314,000 | $108,694 | $205,306 |
| 2024 | $6,196 | $321,000 | $108,694 | $212,306 |
| 2023 | $5,373 | $344,064 | $104,797 | $250,203 |
| 2022 | $6,640 | $312,785 | $95,906 | $262,607 |
| 2021 | $6,321 | $294,620 | $63,938 | $230,682 |
| 2020 | $5,909 | $258,500 | $63,938 | $213,121 |
| 2019 | $5,607 | $235,000 | $63,938 | $171,062 |
| 2018 | $4,952 | $205,000 | $63,938 | $141,062 |
| 2017 | $4,820 | $195,000 | $63,938 | $131,062 |
| 2016 | $4,294 | $180,000 | $63,938 | $116,062 |
| 2015 | $3,713 | $169,000 | $63,938 | $105,062 |
| 2013 | -- | $159,000 | $64,868 | $94,132 |
Source: Public Records
Map
Nearby Homes
- 2100 Fairfax Rd
- 2120 Fairfax Rd
- 2012 Hollyhill Ln
- 412 Hollyhill Ln Unit 412
- 408 Hollyhill Ln
- 2216 Jefferson Trail
- 2226 Savannah Trail
- 2218 Southridge Dr
- 924 Ridgecrest Cir
- 829 Skylark Dr
- 1000 Lynhurst Ln
- 209 Pennsylvania Dr
- 821 Sandpiper Dr
- 824 Sandpiper Dr
- 1412 Ridgecrest Cir
- 816 Chapel Dr
- 1500 Sandy Creek Dr
- 916 Smokerise Cir
- 2253 Hollyhill Ln
- 1012 Indian Ridge Dr
- 2024 Pembrooke Place
- 2016 Pembrooke Place
- 2101 Savannah Trail
- 2105 Savannah Trail
- 2100 Pembrooke Place
- 2025 Pembrooke Place
- 2021 Pembrooke Place
- 2029 Pembrooke Place
- 2017 Pembrooke Place
- 2109 Savannah Trail
- 2104 Pembrooke Place
- 2005 Pembrooke Place
- 2009 Pembrooke Place
- 2100 Savannah Trail
- 2013 Pembrooke Place
- 2101 Pembrooke Place
- 2108 Savannah Trail
- 905 Chasewood Ln
- 2108 Pembrooke Place
- 2113 Savannah Trail